(To see worldwide results, click here.)
This time around there was only one compulsory question: are you in the UK y/n? About a quarter of participants were, and so I tackled the smaller data set first.
[LINK TO RESULTS ON GOOGLE SHEETS]
It was a voluntary self-selecting survey using Google Forms that ran for one week ending 15th February 2015, and there were 637 UK participants. The survey was promoted though Tumblr, Twitter, Flight Rising, Reddit, and various participants’ private recommendations on LGBT mailing lists – and possibly more that I’m not aware of.
1. Which of the following best describe(s) how you think of yourself?
This question also reminded participants that the survey was aimed at “people who are not just men all the time or just women all the time”. The question was optional, and only one person declined to answer.
Despite being able to choose multiple words from the randomised list of 17, the most common number of genders chosen was one (25%). (More here.) People made good use of the “other: [fill in the blank]” box, entering 55 genders I hadn’t listed, including 39 that were entered only once. The mean number of genders chosen per person was 3.3.
The most popular words people used were nonbinary (60%), genderqueer (39%), and genderfluid (30%).

My plan for next year is to include as options anything that got over 1% this time around. This time, every gender explicitly mentioned got over 1% – and one that wasn’t mentioned, demigender, will join the list next year. It even got more than three of the words I explicitly listed, so I’m wondering how I missed it off! Words entered in all the “other” boxes will be counted next year, too.
2. In a magical world where all title fields on forms were optional and write-your-own, what would you want yours to be?
This question was optional, and participants could only select one from the randomised list of six gendered and non-gendered options. As a guide, participants were asked which they’d like to put on their bank cards and job applications.
Most popular choices were no title at all (43%) and Mx (37%) – everything else including the standard gendered titles (Mr, Ms, etc.) got less than 6%. (Summary here.)
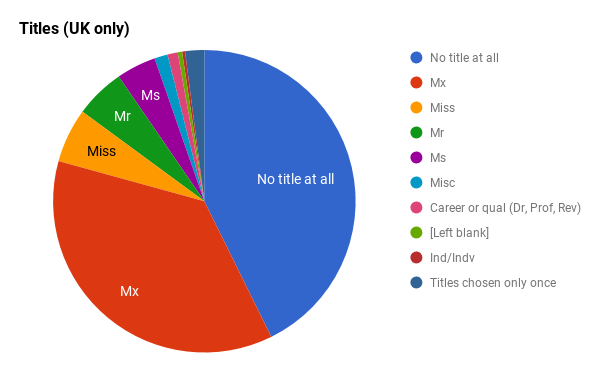
Despite people being very vocally in favour of Dr being provided as an option on future surveys, only 7 people (1.1%) entered a title based on career or qualification into the “other” box – and not all of those were Dr. As it’s over 1% I will be adding it to next year’s survey as an explicit option.
“New” titles aside from Mx such as Ind, Per, and Ser were not often entered – Ind was entered only twice and spelled in two different ways, though both were short for individual, and every other new title was entered only once each.
The results of this question really emphasise how important it is for companies and organisations who want to be inclusive to allow people to have no title at all on their records.
3. Supposing all pronouns were accepted by everyone without question and were easy to learn, which pronouns are you happy for people to use for you?
This turned out to be my favourite, somehow. I started out being all “argggg why are there 17 different spellings for xe/xim?” and feeling like secretly everyone was just trying to score really highly in Scrabble, but by the end of it I was full of happy for the creativity and ingenuity of nonbinary people.
Next year I do intend to clean up how I present the pronoun options, by including all five forms of each pronoun for clarity – and hopefully that’ll prompt people to include more pronoun forms in the “other” box. (This time we got “ar” and “es” – no other information about either of them were provided.)
People could select multiple pronouns from the randomised list of ten, and the most popular by a long way was singular they (75%), with he/him and she/her coming joint-second at 22.3% each – both got chosen 142 times. (More information here.) The mean number of pronouns per person was 1.9.
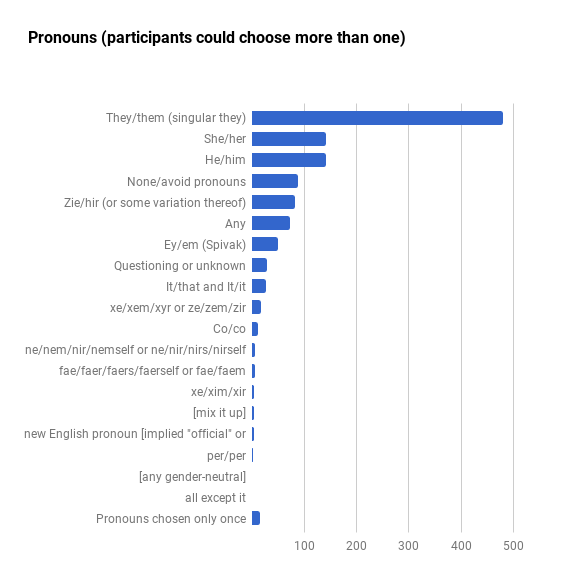
Pronouns that were not listed but that nevertheless went over 1% were xe/xem/xyr or ze/zem/zir, which I categorised together because they sound the same but are spelled differently. Together they were chosen 18 times (2.8%).
Feedback
- I managed to forget to add a feedback box until over 500 people had responded (though we can assume that only 25% or so were from the UK). Nevertheless, I got some useful info.
- Despite many people mentioning in the feedback box that trans* was variously transphobic, exclusive of nonbinary people, etc., 14% of people identified with the term.
- Despite many people mentioning that it/it/its was offensive in various ways and for various reasons, 4.1% of participants were happy for people to use it for them – though some did specify that it depends a lot on factors such as who’s calling them “it” and the tone they’re using.
- People expressed goodfeels about how short, easy, and inclusive the survey was. Many people were nonspecifically grateful and appreciative, which always makes my job more enjoyable. Hello and thank you, nice people! *waves*
What I’ll do differently next time
- I’m hoping to move away from Google Forms/Sheets, just because I think people would feel safer and more comfortable with a system known for its security and privacy. If anyone has any recommendations I’m open to them!
- I’ll be including anything that got over 1% this time.
- I’ll be including my email address somewhere so that people can contact me personally instead of having to leave messages in the feedback form with their name and email address (or wade through search results to find a way to privately message me somehow).
- Outside of the survey, someone asked if I’d consider asking about non-gender-based courtesy address as a fourth question. (“Excuse me, sir/madam/[neutral equivalent], could you pass me that…”) I’m strongly considering it, because it definitely fits into the category of “language used for nonbinary people”.
- I will specify English-speaking. There were a surprising number of people who spoke languages other than English, and taught me about pronouns in their native tongue, and it was wonderful. Many of them used the “other” box to say things like, “English isn’t my first language but these are my preferences in English”, and it’s a good point – I should be more specific and clear next time.
- I will be more age-inclusive, by including “young” forms of words – woman/girl rather than just woman, for example.
Closing thoughts
These results answer some questions I’ve been asking myself for a while now.
- What should the third gender option on forms be called? – Nothing! There is no consensus, and even the most popular word (nonbinary) doesn’t work for 2 in 5 of us, which is significant.
- Is there a standard neutral title yet? – Not yet. Mx is close, but more people would rather just not have a title at all. I can use this data to campaign for companies and organisations to first have titles be optional, and second provide at least one inclusive title, most likely Mx.
- Is there a pronoun that every nonbinary person is happy with? – Not yet. The closest we have to a standard is singular they, and so I will use the data to campaign for journalists and anyone else with a style guide to allow it. But 1 in 4 of us are not happy with singular they, so perhaps there is still scope for one neutral singular pronoun to gain popularity.
- Are any of the neopronouns gaining ground in a way that competes with singular they? – Not yet. Sometimes I wonder if people’s efforts to create a new standard is just causing more fragmentation. (See also: xkcd Standards) Even the new pronouns that are easy to pronounce are often spelled differently by different people, as well as not being intuitive to use or pronounce. But these are personal concerns with no evidence to back them up, and I look forward to keeping an eye on the neopronouns from year to year, to see if any of them “stick” or gradually increase in use.
I am particularly glad that I was so thorough, counting every “other” even if it was only selected once. Last time I was pretty vague with the statistical analysis and focused on the more popular choices, and as a result I couldn’t really answer any of the above questions in any kind of definite way, which bothered me. This has been a much more satisfying route.
This has been a really interesting survey for me, and there will no doubt be more interesting to come with the other three-quarters of the data that I still have to work on. I have learned a lot, and I appreciate every response.
I hope others can use the results for positive things! Thank you very much, everyone.
2015-02-16
email: hello@gendercensus.com