In 2018 I spaced out work on the survey into several smaller blog posts throughout the year, in the hope that it would be less exhausting, and I think it has worked! In this article I will combine all the UK data into one report, and compare it with the worldwide data.
The survey took place between 1st February and 25th March 2018, and there were 11,278 respondents, of which 1,535 said they were living in the UK (compared to 1,357 UK participants last year).
The spreadsheets are split this year. Links: questions one, two, three, four, and the original spreadsheet of all responses.
Q1: The spelling of non-binary
The first question in the survey was: How do you think this word should be spelled? The options were:
- nonbinary
- non-binary
- non binary
- I don’t know/I don’t care
- Other [text box]
The first three options, bolded, were randomised. I asked this question first because there was also a question about how people identify, and I had to choose a spelling for the checkbox option for nonbinary, and I didn’t want my choice for the survey to sway the results of this question. I also avoided using the word nonbinary in all promotional materials.
You can see and download the Google Sheet of the results here and you can see a more in-depth report here.
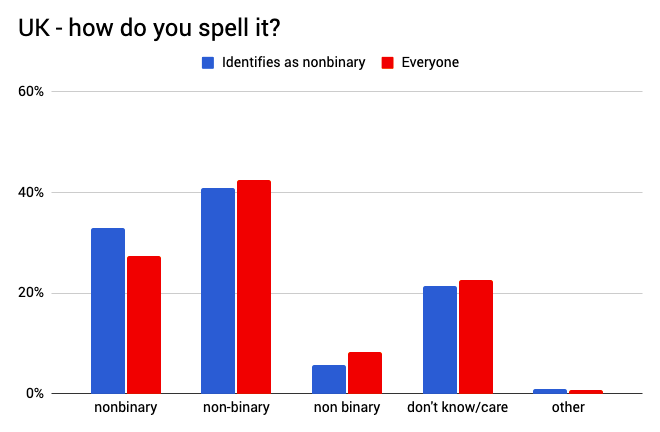
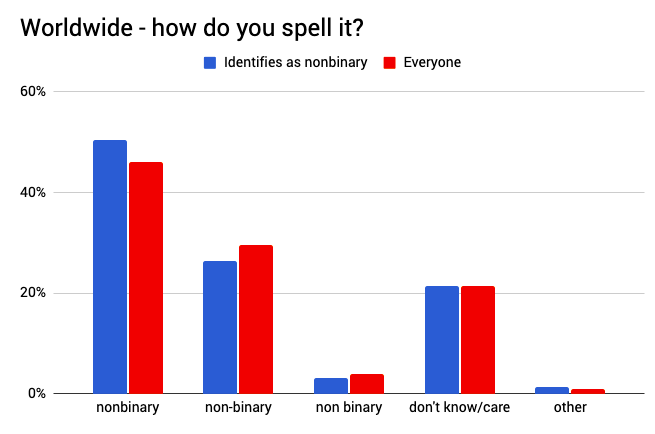
So what we can see is that people who identified as nonbinary were consistently more likely to prefer no hyphen than those who didn’t identify as nonbinary.
But we also see that UK participants overall spelled it with a hyphen, whereas worldwide participants (mostly USA, I’d guess) preferred no hyphen. That makes sense, because the British English conventions tend towards including hyphens.
Since the international preference is for no hyphen, and it’s an international survey, I’ll be spelling it nonbinary in future surveys.
Q2. Identity words
I asked, Which of the following best describe(s) in English how you think of yourself?
There were 23 checkbox options, and participants could check as many boxes as they wanted. You can see the spreadsheet of all 11,000+ responses for this question, as well as the graphs in more detail, here on Google Sheets and you can see the report about identity words only here.
The top five identity words in the UK were:
- nonbinary – 57% (down 7.6%)
- trans – 34% (up 1.7%)
- transgender – 28% (up 1.8%)
- genderqueer – 28% (down 5.5%)
- agender – 23% (down 4.8%)
Nonbinary and genderqueer have dipped significantly this year, which I think is at least in part due to my efforts to make the promotional materials more inclusive and less biased. I didn’t use those words in promotional blog posts or as tags or in the introductory text on the survey itself, and I changed the title of the survey from Nonbinary/Genderqueer Survey to Gender Census.
Here’s everything that got over 1% worldwide, comparing the UK results to the worldwide results:

You can see a larger version of this chart by clicking through to the Google Sheet linked above.
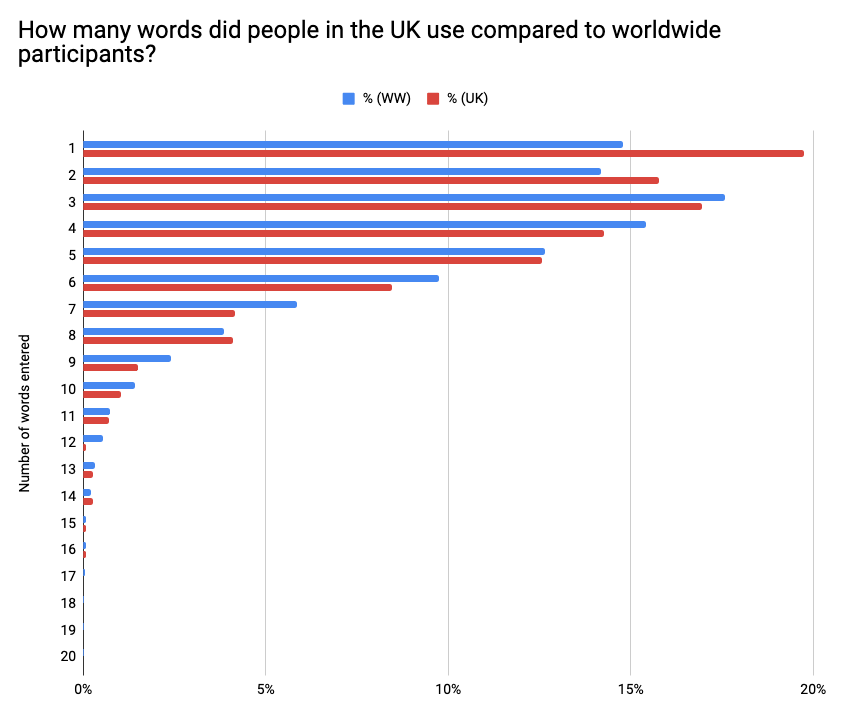
All the top ten words were chosen less often in the UK, but we in the UK are apparently more comfortable with the words transgender, woman, and transfeminine – and we’re also more likely to not describe our genders at all.
I think the reason for this striking difference is that UK participants used fewer words to describe themselves on average – worldwide participants most often used 3 words, whereas UK participants used only 1.
In all there were 379 unique write-ins, of which two were words that were entered by over 1% of UK participants, which means next year the following words will be added to the survey’s checkbox options:
- queer – 2.9% (2.8% UK)
- genderless – 1.1% (0.8% UK)
- demiboy – 1.1% (1.2% UK)
- demigirl – 1.1% (0.9% UK)
- gender non-conforming – 1.1% (0.3% UK)
People seem to want to specify demiboy or demigirl even when demigender is an option, so I think it might be wise to remove demigender from the list and see what happens. It might be that over 1% of participants will write in demigender, in which case I will re-add it to the checkbox list.
Gender non-conforming was a tricky one to count. I had sorted the list of write-ins alphabetically and I noticed that it was being entered many times but being spelled in a lot of different ways, and therefore wasn’t being counted properly. When I searched the worldwide list for “conform” I found 23 unique spellings, 15 of which had been entered only once. When they were combined there were 122 participants entering some variation, with “gender non-conforming” being the most popular, so I will be adding that to the next survey.
Fun UK facts:
- 73% of write-ins were entered only once, and 109 words were written in more than once.
- 38% of participants used the write-in box.
- When the write-in boxes were used, on average people wrote in 1.6 new terms each (high compared to the 1.4 average worldwide).
- 14 people, or 0.9%, used all five boxes.
- The mean number of identity words (including the checkboxes) was 3.8 each, and the most common number of identity words chosen/written was 1.
- 92% of UK participants chose 1-7 words.
Q3. The title question
I asked, Supposing all title fields on forms were optional and write-your-own, what would you want yours to be in English? I also clarified that participants should be currently entitled to use it, so they should have a doctorate if they choose Dr, etc.
There were 5 specific titles to choose from, plus a few options like “I choose on the day” and “a non-gendered professional or academic title”. Participants could choose only one, with the goal of finding out what, when pressed, people enter on official records forms and ID. You can see the spreadsheet of all 11,000+ responses for this question, as well as the graphs in more detail, here on Google Sheets.
The top 5 were:
- Mx – 38.6% (up 1%)
- No title at all – 27.4% (up 0.2%)
- Mr – 8.1% (up 2.3%)
- Ms – 7.8% (up 4.7%)
- Miss – 5.5% (up 1.3%)
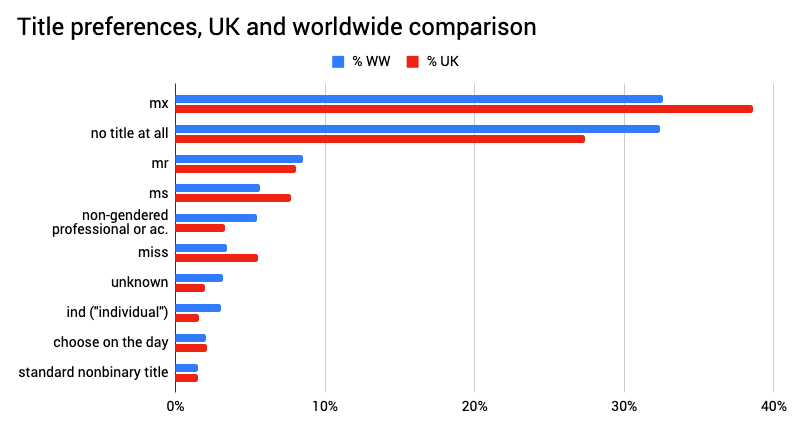
As is fairly consistent with previous years, we’re more likely to favour Mx and less likely to favour no title at all compared to worldwide participants generally. Anecdotally speaking I do hear that British systems and organisations are more insistent on titles than for example American ones, so perhaps we’ve collectively found that picking a neutral title will be less hassle for us than fighting for a titleless existence.
Of the 23 people (1.5%) who said that in an ideal world they prefer a gender-exclusive title, only 3 used the text box provided. The text box asked people to specify what that gender-exclusive title would be, and only one person gave a specific title: Pr.
So I’d say that we do not currently have a gender-exclusive nonbinary title yet in the UK, and the picture is very similar worldwide.
(By “gender-exclusive nonbinary title”, I mean a title that denotes a nonbinary gender, as generally speaking Ms denotes a female gender and Mr denotes a male gender.)
Q4. The pronoun question
The fourth question was actually a complex set of questions, which started with Supposing all pronouns were accepted by everyone without question and were easy to learn, which pronouns are you happy for people to use for you? This was accompanied by a list of pre-written checkbox options. It included “a pronoun set not listed here”. and if you chose that it took you to a separate set of questions that let you enter up to five pronoun sets in detail.
You can see the spreadsheet of results for just the pronouns question here, and a more detailed report here.
Everything that was a pre-written checkbox option got over 1%.
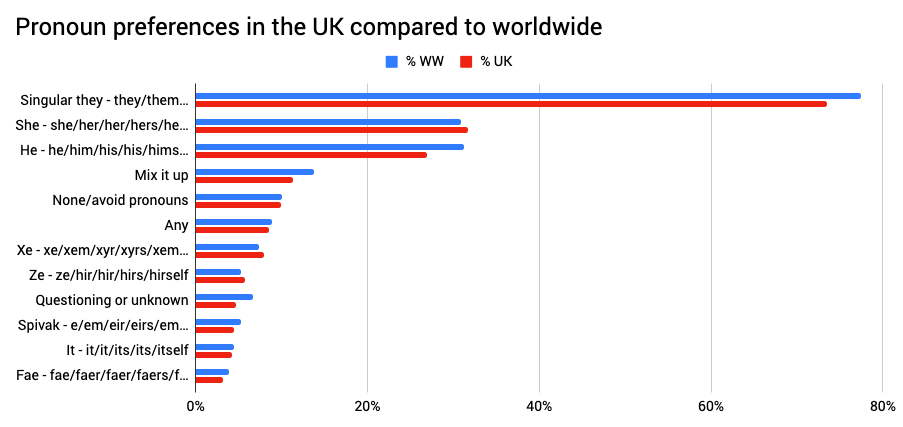
Here’s the top 5 for the UK:
- Singular they – they/them/their/theirs/themself – 73.6% (down 4.9%)
- She – she/her/her/hers/herself – 31.7% (up 3.8%)
- He – he/him/his/his/himself – 26.9% (down 2.9%)
- Mix it up – 11.3% (down 0.6%)
- None/avoid pronouns – 9.9% (down 0.4%)
It’s the same five as last year, but in a slightly different order – he/him and she/her have swapped places. Here’s the sets that were chosen by UK participants over 1% of the time:
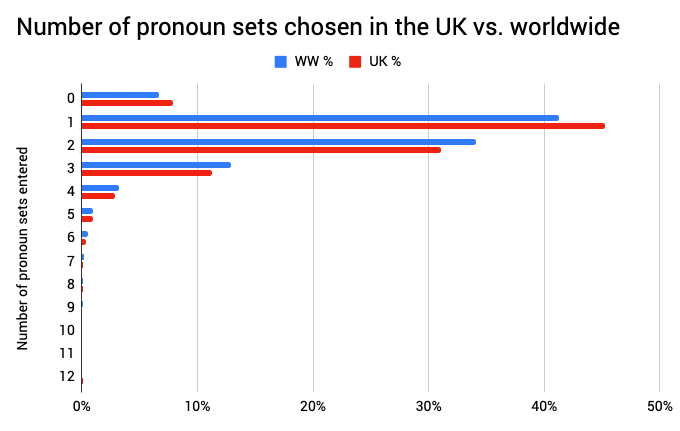
As with identity words, we in the UK were more likely to use fewer pronouns each:
Neopronouns
Even when you only count the first form of each neopronoun set (xe, or ae, or ne), the most any neopronoun set got was 0.5%.
Here’s the top 5:
- ze (singular verbs) – 0.52%
- they (plural verbs) – 0.39%
- ve (singular verbs) – 0.39%
- ey (singular verbs) – 0.33%
- ae (singular verbs) – 0.20%
In the end, the most popular neopronoun sets were in the checklist options, which makes sense – being able to check a box is much easier than having to enter five forms for each neopronoun set that you’re happy for people to use for you, as is remembering sets that you’re happy for people to use when talking about you. The popular neopronouns from the checklist options were:
- Xe – xe/xem/xyr/xyrs/xemself – 7.9% (122 people)
- Ze – ze/hir/hir/hirs/hirself – 5.7%
- Spivak – e/em/eir/eirs/emself – 4.5%
- Fae – fae/faer/faer/faers/faeself – 3.2%
In the UK we were slightly less likely to use neopronouns than participants worldwide.
I am extremely happy with the improvements to this question. It’s great to get more complete information about neopronoun sets, and to be able to say with certainty exactly how each neopronoun set is most commonly composed. Next year I would like to expand this question to collect data about how people tend to gender their neopronoun sets, as I did a few months back when I ran the pronoun-specific survey that helped inform this question.
If you’re not super familiar with neopronouns, you can see the more popular ones from the worldwide results in use here.
Here’s some fun statistics:
- 25 unique pronouns were typed into the “other” box more than once.
- 50 pronouns were typed into the “other” box only once. This is much higher than last year because we’re collecting more accurate information about variants now.
- Including the checkbox options that’s 71 pronoun sets in total.
- People chose on average 1.6 acceptable pronouns each, lower than the worldwide average of 2.
- Most people (45%) chose only one pronoun, slightly less than last year.
- About 76% of people were happy with only one or two pronouns – higher than last year’s 72%.
The questions I ask
- What should the third gender option on forms be called? – Still no consensus in that area. Nonbinary is consistently most popular, is at 57% this year, and is still twice as popular as the next specific word (genderqueer), so it’s promising. But there’s still almost half of UK respondents not identifying as nonbinary, so I don’t feel comfortable jumping to that conclusion just yet.
- Is there a standard neutral title yet? – Not yet. Mx is still consistently far more popular than all other titles, but almost as many UK-based nonbinary people want no title at all. It’s really important that activists campaigning for greater acceptance of gender diversity remember to fight for titles to be optional, too.
- Is there a pronoun that every nonbinary person is happy with? – No. The closest we have to a standard is singular they, and it’s important for journalists and anyone else with a style guide to allow it. But around a quarter of us are not happy with singular they, and 10.6% of us don’t like he, she or they pronouns.
- Are any of the neopronouns gaining ground in a way that competes with singular they? – No. This year the closest is “Xe – xe/xem/xyr/xyrs/xemself” (7.9% compared to singular they’s 73.6%). Users of these neopronouns will probably not reach consensus for many years – language and especially pronouns can be very slow to settle and gain ground. Even if one neopronoun does become very commonly used, many will continue to use other neopronouns for a long time to come.
This year in review
The survey hasn’t changed much, but the way I approach working on it has.
- Being disabled and moving house meant my energy levels were pretty unreliable. I took a bit-by-bit approach, processing the results for one question at a time and then writing up a report, before compiling everything into one large report. That’s why each question has its own Google Sheet! (Questions one, two, three, four, and the original spreadsheet of responses.)
And the number of people involved in the survey has increased such that I’ve needed to start paying for more stuff.
- I crowdfunded for the survey fees again, but I included fees for the domain name and the email server so I can use proper mailing list, because Gmail wouldn’t let me email everyone about the results last year. There are just too many of you.
What I’ll do differently next year
- I will make the wording in the promotional materials more inclusive. This year I made an image for the tweets and blog posts that had the words “male” and “female” on and there was some confusion over whether I meant gender or sex. (I meant both.) Next year I will refrain from using these words, and possibly use a non-text way to convey what I mean, so that potential participants aren’t put off by language that they feel excludes them.
- I’m actually pretty happy with how I handled most of it. I think the software is probably the best I’m going to find, the site and domain and mailing list set-up is a big improvement, the wording of the questions and the answer responses seem to be working.
- I think if I ask a one-off question in 2019 it’ll be family words, such as neutral words for aunt/uncle, nephew/niece, etc.
Closing thoughts
I continue to be a little overwhelmed when the responses start rolling in at hundreds per hour. I love mashing the numbers about and getting something informative and interesting out of them, and I really hope other people enjoy reading the results! You’re all fab for trusting me with your answers too. Thank you.
Support me!
I do this basically for free (the crowdfunded money went entirely on survey software and domain fees), so if you happened to stumble onto my Amazon wishlist and accidentally fall on an Add To Cart button… well, I would be immensely grateful. 😉 If you wanted to go and check out Starfriends.org too I reckon Andréa would be pretty chuffed!
2019-01-04
email: hello@gendercensus.com