Contents
- Q1: Identity words
- Q2: Titles
- Q3: Pronouns
- Age and referrers
- Some of the questions this survey seeks to answer
- In vaguely related news
- External links
This report is intended to be a fairly brief overview of only the UK responses from this year’s Gender Census, with some comparison to the worldwide results. For an international report with a lot more detail, click here.
This year’s Gender Census, aimed at everyone whose gender(s) or lack thereof are not adequately described by the gender binary of “always, solely and completely male OR always, solely and completely female”, was open from 10th February until 10th March 2021.
There were 44,583 usable responses, of which 5,411 were from the UK. You can see the spreadsheet of only the UK responses in the external links section below. In all cases below, the worldwide statistics include UK reponses.
Q1. Identity words
As usual, I asked: Which of the following best describe(s) in English how you think of yourself? Participants were invited to choose as many as applied from a checkbox list of 30 words or phrases, and then given textboxes to type in up to 5 more words and phrases.
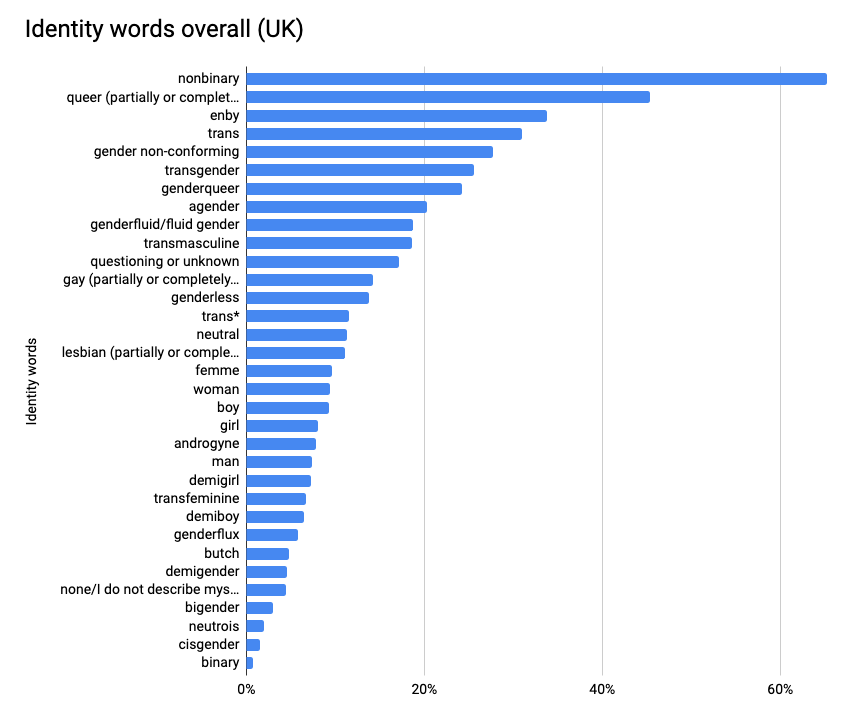
Here’s the UK’s top 10:
- nonbinary – 65.2% (up 3.5%)
- queer (partially or completely in relation to gender) – 45.4% (up 5.6%)
- enby – 33.7% (up 6.6%)
- trans – 31.0% (up 0.4%)
- gender non-conforming – 27.7% (up 4.7%)
- transgender – 25.5% (down 0.8%)
- genderqueer – 24.3% (up 0.7%)
- agender – 20.3% (up 1.3%)
- genderfluid/fluid gender – 18.7% (up 0.8%)
- transmasculine – 18.6% (up 2.2%)
Here’s how that looks as a graph:
It’s getting a little cramped, I might have to show only the top 20 on a graph next time. Here’s a graph comparing the top 15 UK and worldwide identity words:
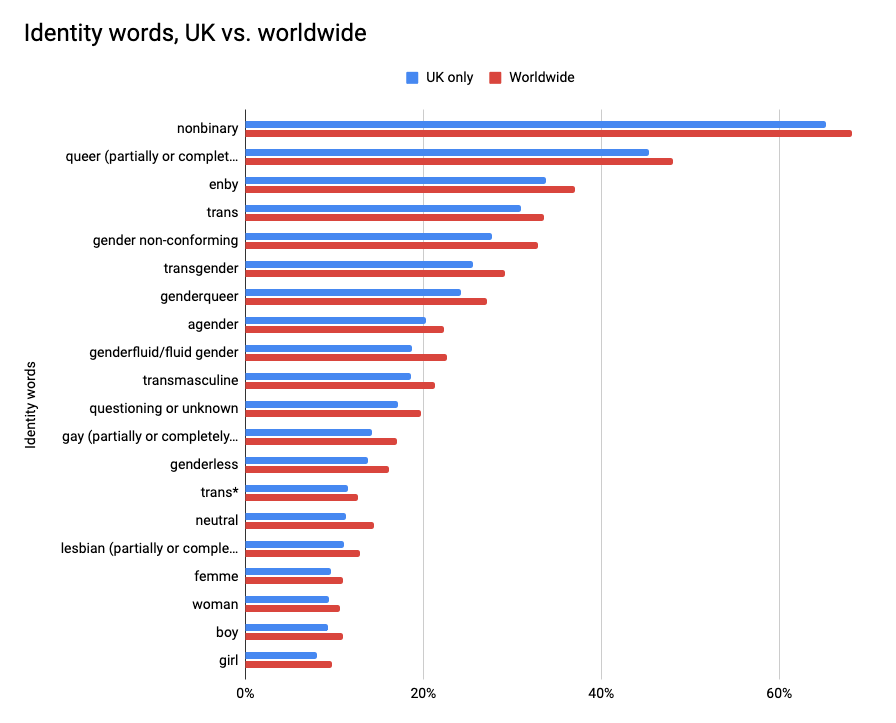
The top 15 was almost the same compared to the international list, but we’ve got trans* (no footnote) in ours, and the worldwide list has lesbian (partially or completely in relation to gender) instead.
Last year I noticed that over-30s were 8% less likely to identify as queer than under-30s in the UK, but this difference wasn’t reflected in the worldwide results. This year the difference in the UK has reduced to 6%, and use of the world queer has increased among both under-30s and over-30s. Queer is still undergoing a process of reclaiming, which is often led by the younger generations who’ve had less experience being abused with those words used as slurs. I know (anecdotally) that homophobic violence and the word queer have had a strong association for gay, bi and trans people in the UK in decades past.† It’s a sensitive issue that I have previously blogged about. I am interested to watch this for a few years and see if we can observe the process of reclaiming.
Like last year, most options were chosen by a higher proportion of participants internationally. It seems we in the UK choose fewer words, with our average of 5.4 (including textbox answers) compared to the international average of 6.1 identity words each.
I am interested to note that the average number of words each has risen since last year by 0.9 in the UK and 1 internationally. This might be connected to there being four more checkbox options on offer this year.
Q2. Titles
I asked, Supposing all title fields on forms were optional and write-your-own, what would you want yours to be in English?
I also clarified that participants should be currently entitled to use it, and it may be worth noting that in the UK participants can use Dr even if they don’t have a doctorate, because anyone can use any title provided they’re not doing so for fraudulent reasons. (Whether participants knew this or wanted to do so is a different matter…)
There were 5 specific titles to choose from, plus a few options like “I choose on the day” and “a non-gendered professional or academic title”, and an “other” option with a textbox. I restricted participants to one title only, with the goal of finding out what, when pressed, people enter on official records forms and ID.
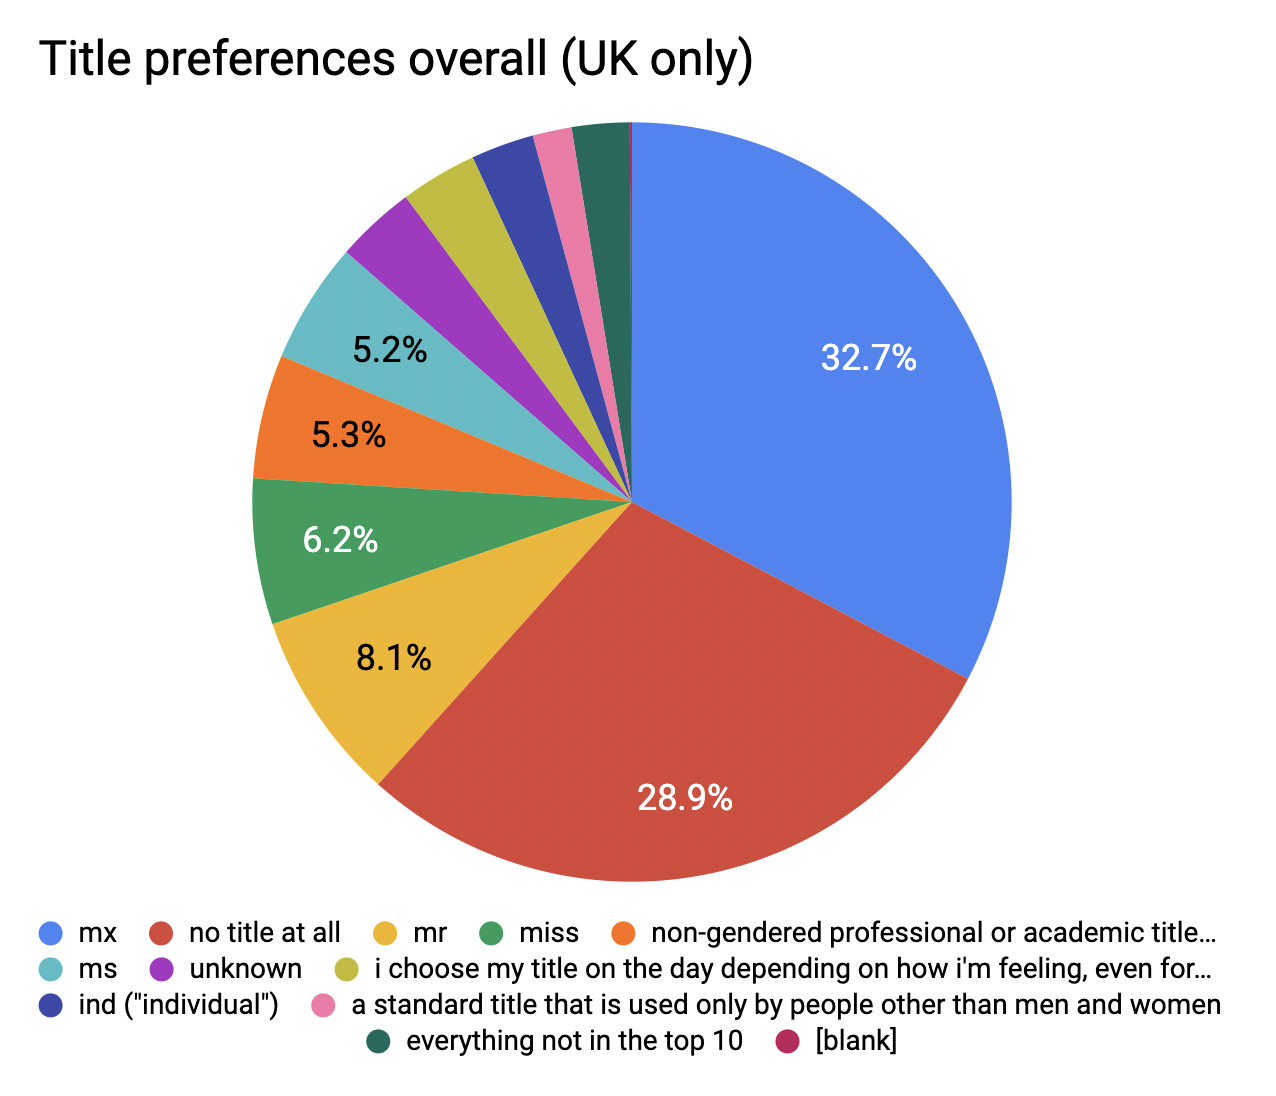
Here’s the titles that got over 5%:
- Mx – 32.7% (down 1.9%)
- No title at all – 28.9% (up 1.4%)
- Mr – 8.1% (down 0.3%)
- Miss – 6.2% (up 0.6%)
- Non-gendered professional or academic title (e.g., Dr, Rev, military rank) – 5.3% (down 0.3%)
Ms has dropped out of the top 5 even though its usurper, Non-gendered professional or academic title, has reduced in popularity slightly.
Here it is as a pie chart:
Same as last year, the age split between Mx and no title that we saw in the worldwide report was also present in the UK, with under-30s being more likely to prefer Mx and over-30s preferring no title:
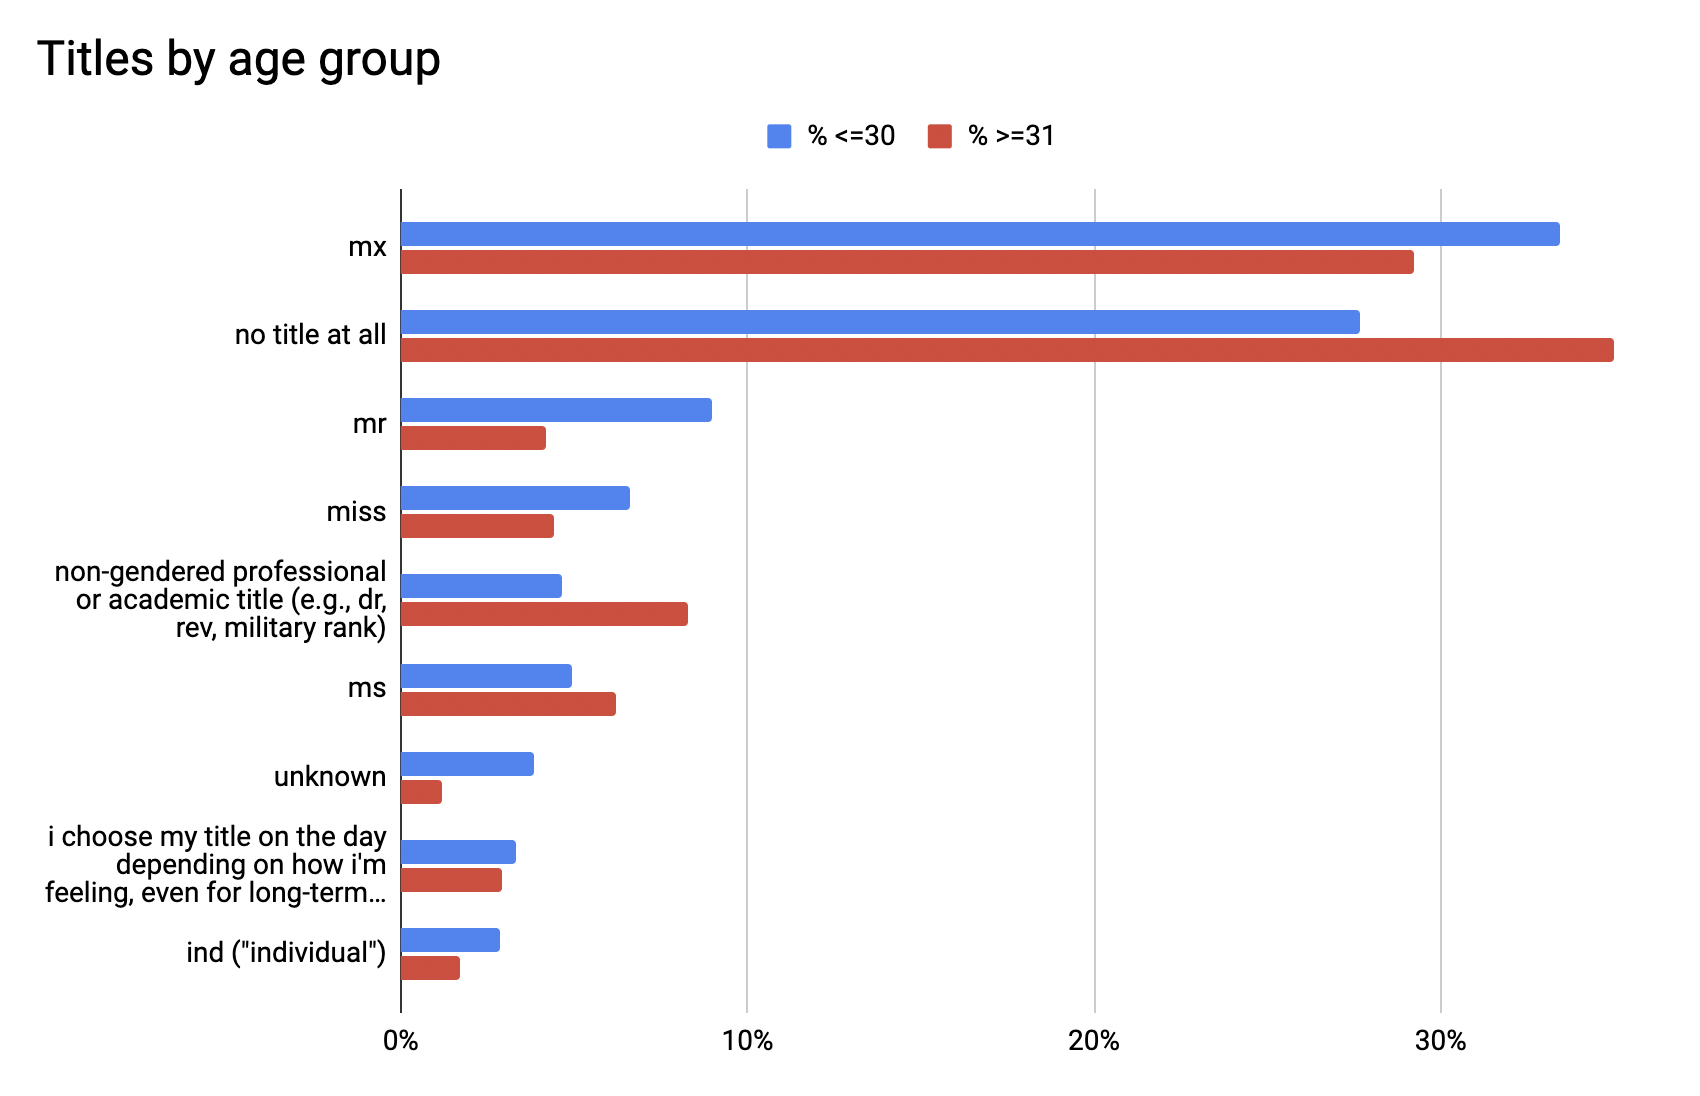
I hear that it’s unusual for titles to be required on forms in the USA – but in the UK it’s common enough that I am often pleasantly surprised when a form’s title field is optional. Often British participants will tell me in the feedback box that they would prefer to not have a title, but systems and records so rarely accommodate it that it has been easier to get an organisation to add an entirely new and little-known title to the list than it has been to persuade them to allow for no title at all. You can see the huge difference between UK and international preferences for Mx vs. no title at the top of this graph:
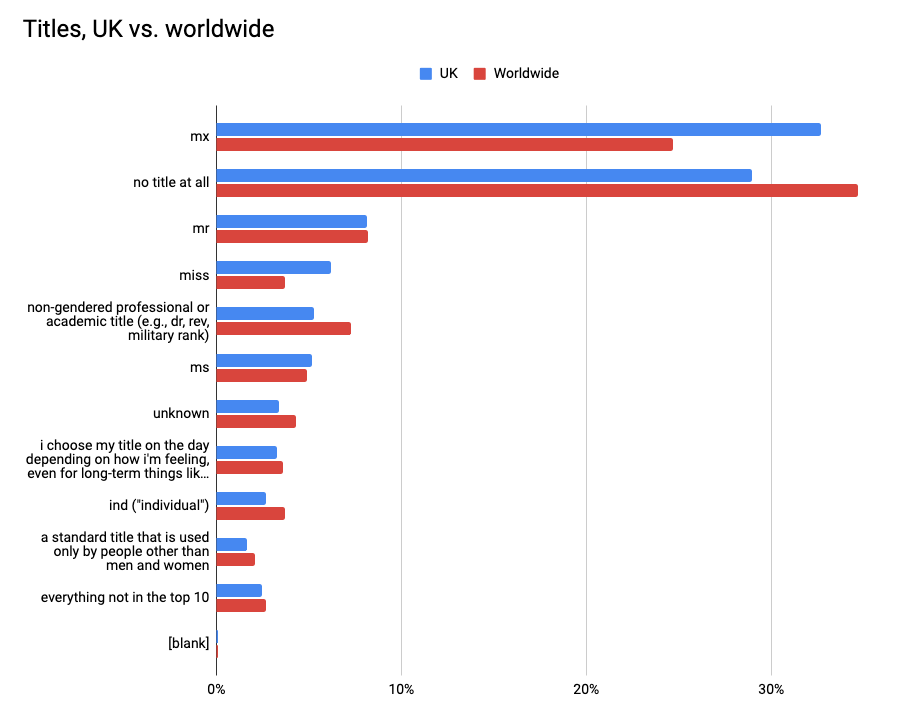
When almost a third of us would prefer to have no title at all, UK activists need to make sure they’re calling for titles to be optional in records to ensure nonbinary inclusion.
Q3. Pronouns
To find out about pronouns I asked a complex set of questions, starting with Supposing all pronouns were accepted by everyone without question and were easy to learn, which pronouns are you happy for people to use for you in English? This was accompanied by a list of pre-written checkbox options. It included “a pronoun set not listed here”, and if you chose that it took you to a separate set of questions that let you enter up to five additional pronoun sets in detail.
Checkboxes
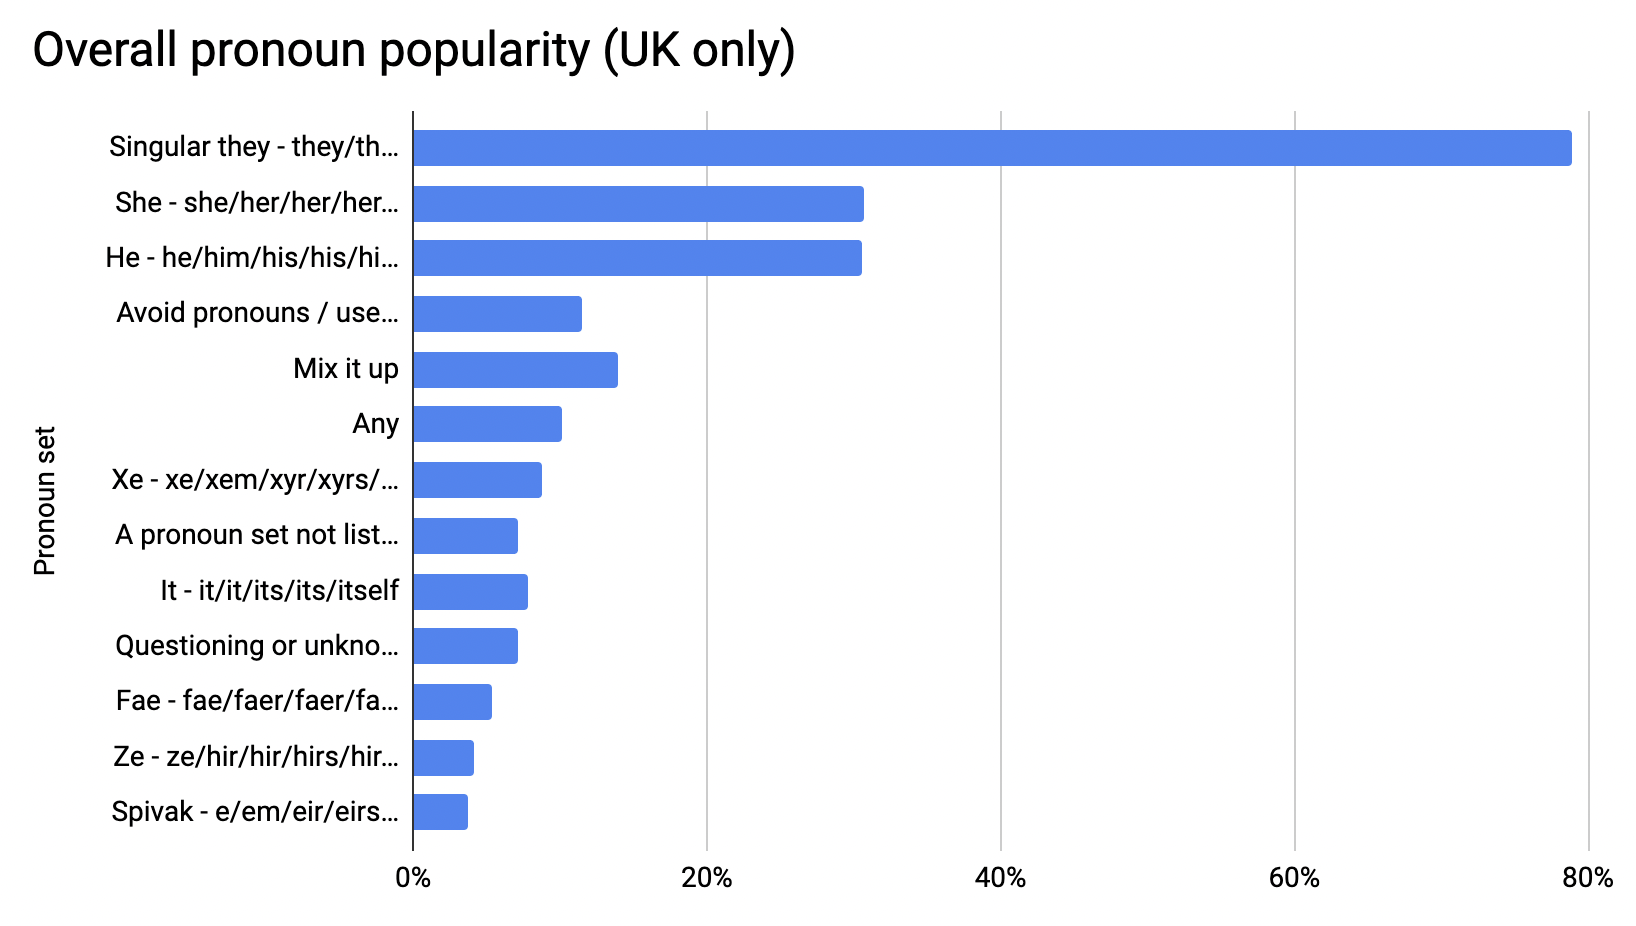
Here’s our top 5:
- Singular they – they/them/their/theirs/themself (plural verbs, i.e. “they are a writer”): 79.0% (up 3%)
- She – she/her/her/hers/herself: 30.7% (up 1.7%)
- He – he/him/his/his/himself: 30.6% (up 2.8%)
- Mix it up: 14.0% (up 1.7%)
- Avoid pronouns / use name as pronoun: 11.5% (down 1.4%)
Compared to last year the top 5 order is the same, except mix it up and avoid pronouns have switched places.
Here’s the graph comparing the UK and worldwide checkbox pronouns:
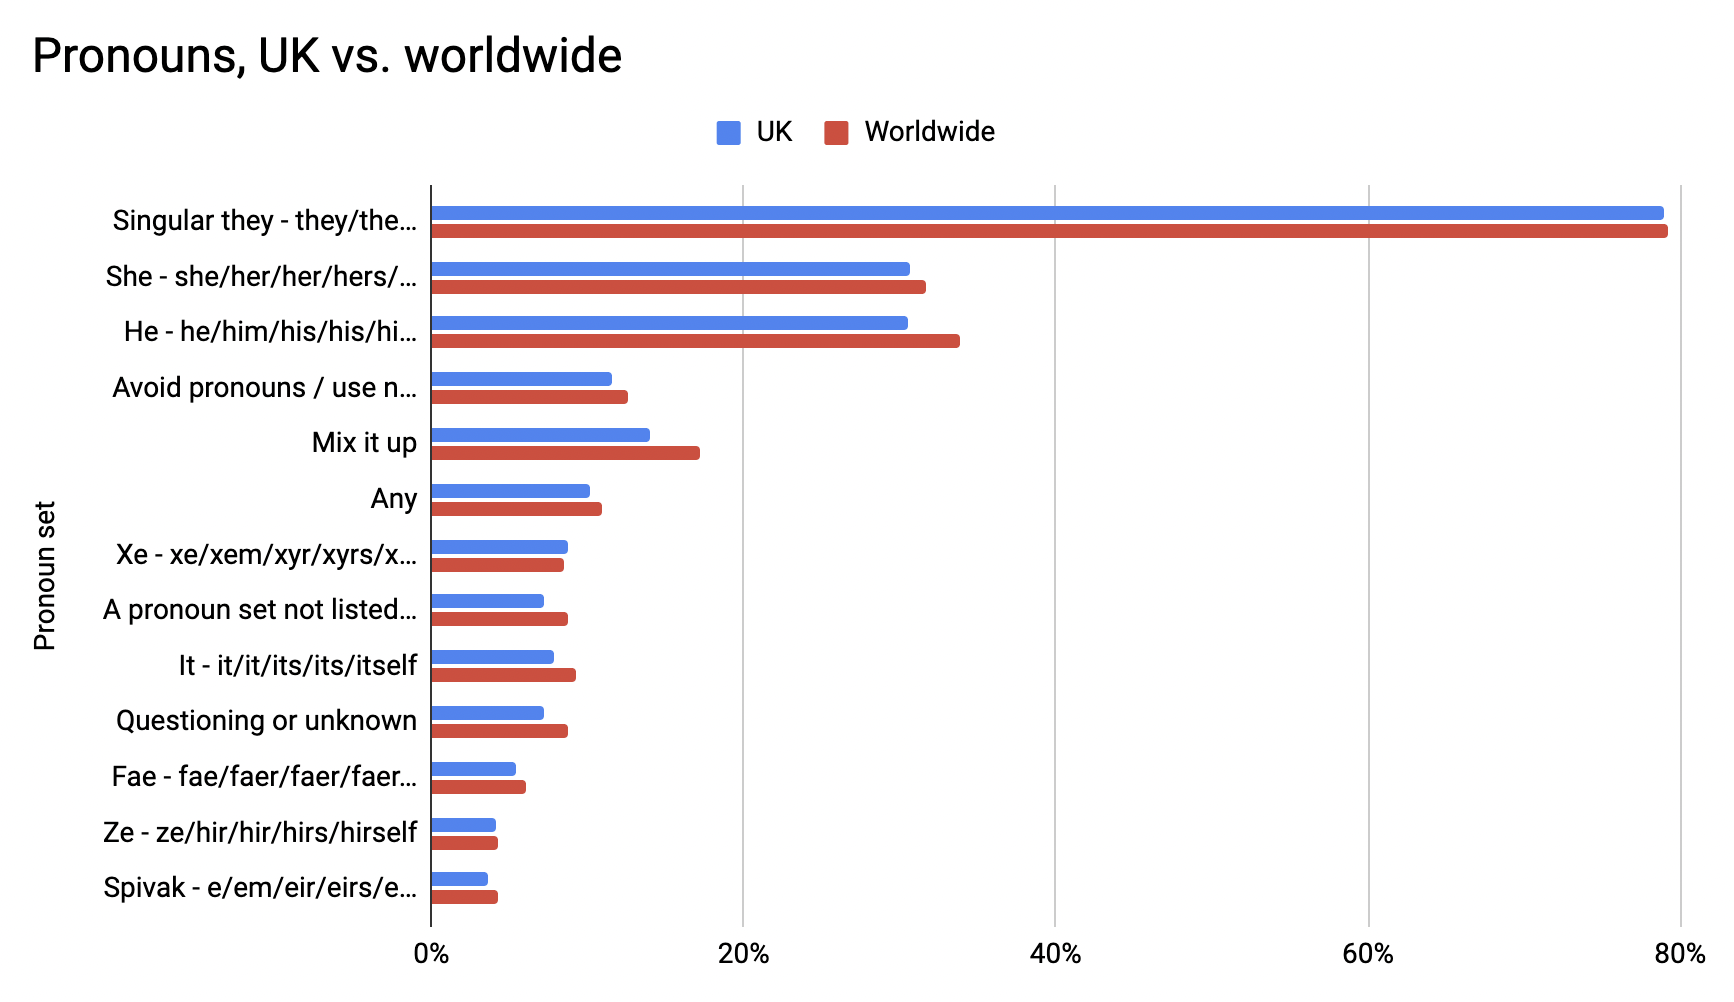
UK and international trends line up pretty well in the checkbox pronouns. There was under 2% difference in most pronouns between the UK and worldwide, with two exceptions: he/him and mix it up were both 3% more popular worldwide. (I think it’s interesting that internationally he/him is more popular than she/her by over 2%, but in the UK there’s virtually no difference. This has been the case in previous surveys too.)
Here in the UK we choose fewer pronoun sets. The most common number of pronoun sets chosen in the UK was 1, and worldwide it was 2 – but only just. (Less than 300 in it!) The UK average was 1.8 sets each (up from 1.6 last year), and worldwide it was 1.9.
The difference in number of pronoun sets between the over-30s and under-30s is interesting:
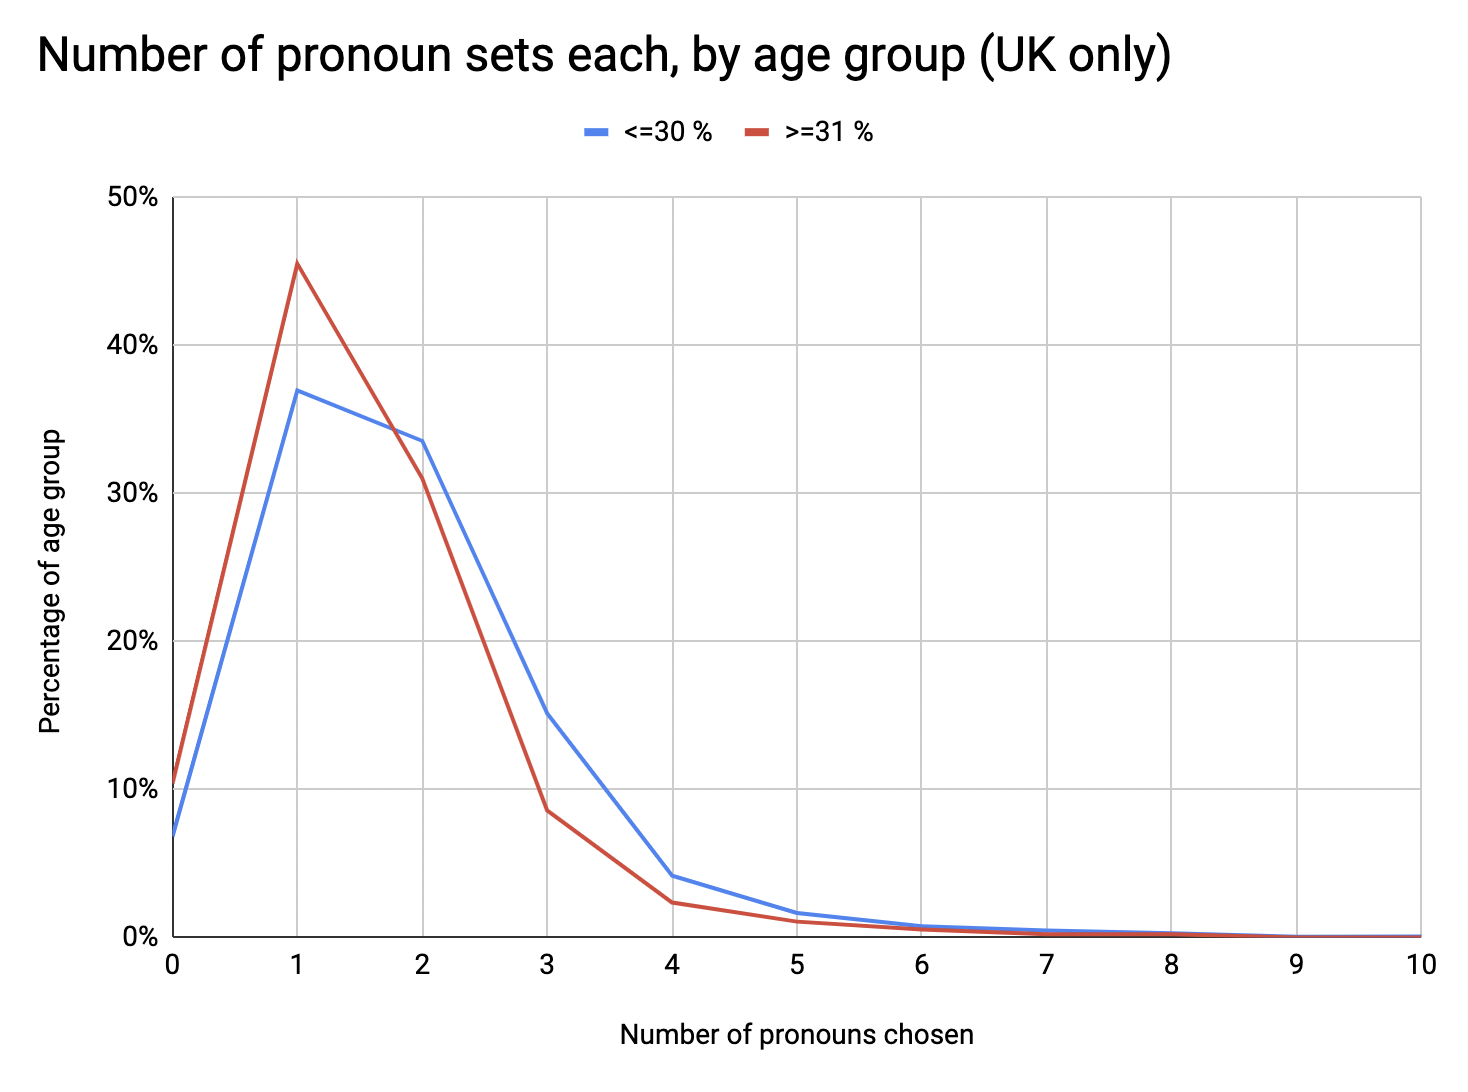
Basically, the younger folks choose more pronoun sets each – but the most common number of sets across both age groups is still one.
10.4% of participants weren’t comfortable with they, he or she, which is 0.6% higher than last year.
Neopronouns
The checkbox list had some neopronoun sets in it, and they are all sets that continue to get over 3% internationally and so will remain in the checkbox list:
- Xe – xe/xem/xyr/xyrs/xemself: 8.8% (up 2.1%)
- Fae – fae/faer/faer/faers/faeself: 5.4% (up 0.3%)
- Ze – ze/hir/hir/hirs/hirself: 4.1% (down 0.4%)
- Spivak – e/em/eir/eirs/emself: 3.7% (up 0.1%)
People in the UK were less likely to type in a set of neopronouns – 7.3% in the UK, compared to 8.8% internationally.
Our top 5 neopronouns entered into the textboxes were:
- ae/aer/aerself – 0.4% (19 people)
- ey/em/emself – 0.3%
- ve/ver/verself – 0.3%
- they/them/themselves – 0.2%
- ze/zir/zirself – 0.2%
The small percentages involved here mean that it’s very easy for the top 5 to change year on year. This year, they/them/themselves is new to the top 5. I would call this set plural they. Since publishing the 2021 worldwide report I’ve run a smaller survey to find out more about plural they, and you can read the analysis here.
Age and referrers
This year the proportion of participants under the age of 30 was much higher than has previously been the case, in the UK and internationally. Like last year, UK participants tended to be a little older – 17.2% of UK participants were over the age of 30, compared to 12.2% of worldwide participants.

I suspect this might be related to referring websites/apps, namely Tumblr. People coming from Tumblr tend to be younger, and the proportion of respondents coming from Tumblr was a little lower in the UK compared to internationally:
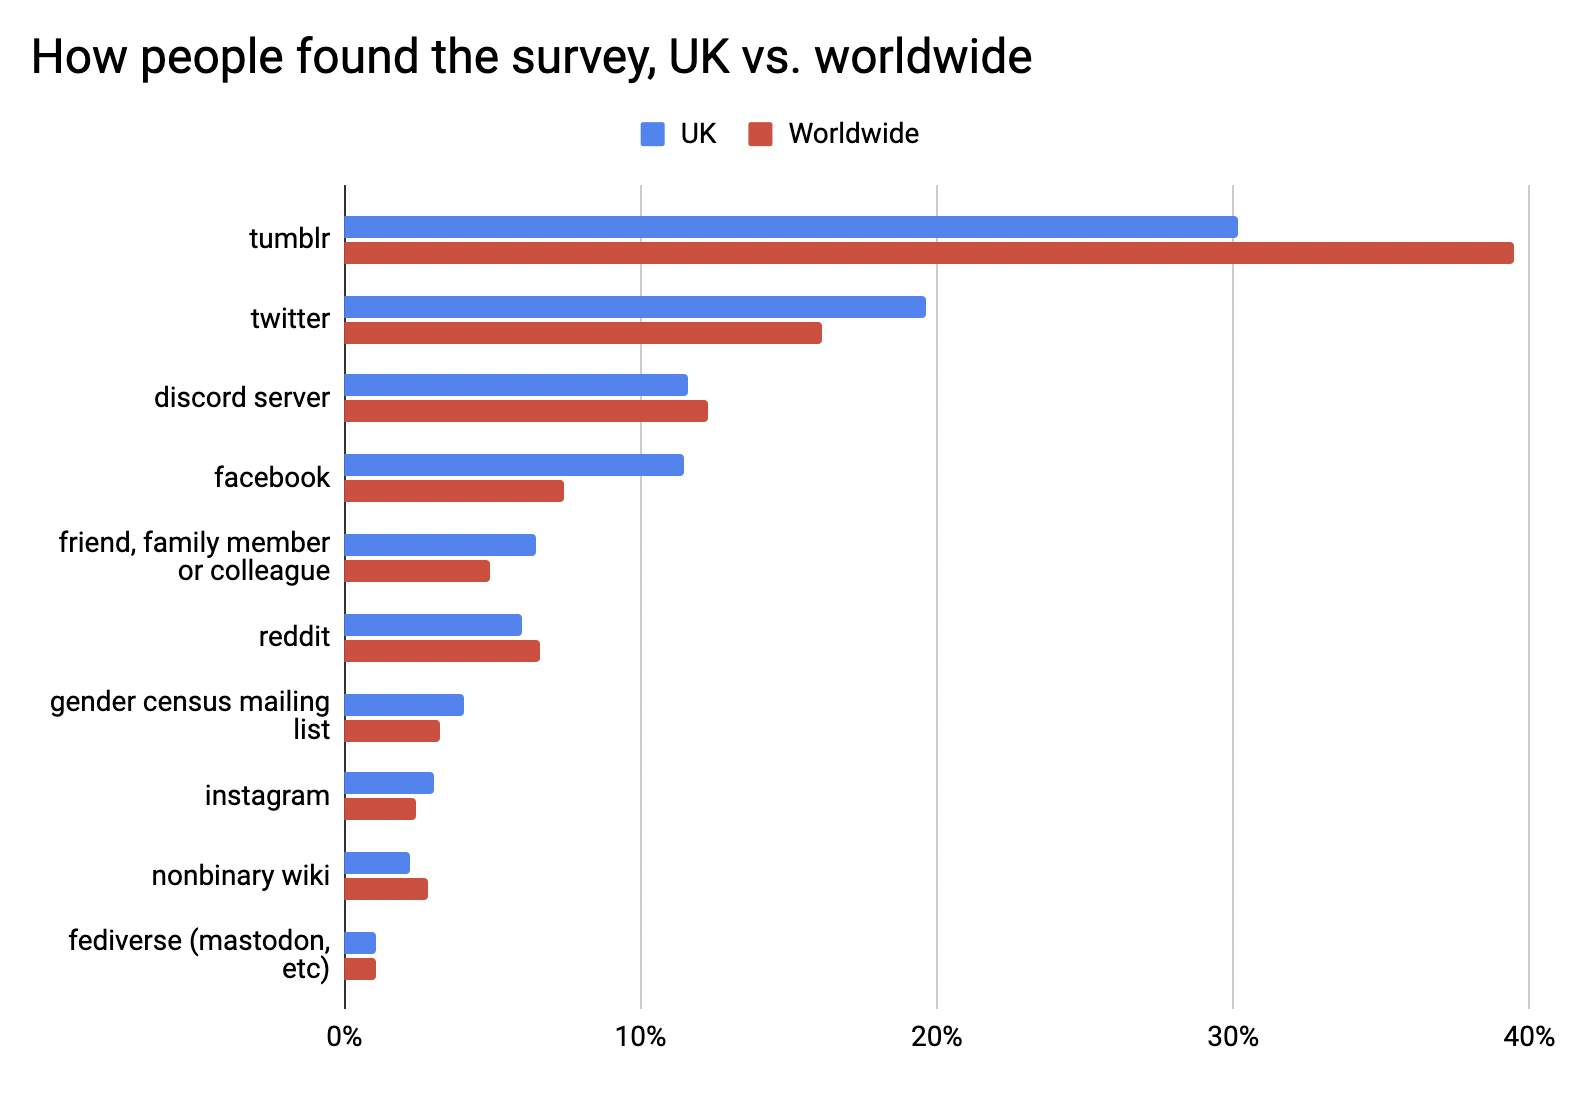
This would explain our sample here in the UK being a little older overall.
You can see more visual-statistical information about referring website and age on the meta spreadsheet here.
Some of the questions this survey seeks to answer
- What should the third gender option on forms be called? – There is no consensus yet, and due to the nature of our genders there might never be one. But nonbinary is in use by about two thirds of us, which means it’s probably a good fallback if you’re not sure what else to call us as a group. Just make sure you give people the option to specify something else where appropriate.
- Is there a standard neutral title yet? – No. Mx is definitely the most popular at one third, but that is quite closely followed by no title at all. If you want to be truly nonbinary-inclusive, make sure that you include Mx and ensure that titles are optional, as that covers almost two thirds of us.
- Is there a pronoun that every nonbinary person is happy with? Singular they is a good option for 4 in 5 of us, is more popular than the next three pronoun sets combined, and has been reliably topping the chart by a similar margin for as long as this survey has been running. Having said that, 1 in 10 of us isn’t comfortable with he, she or they. If you’re not sure how to refer to a nonbinary person and you can’t ask, they is a good fallback – but if you can ask, do so.
- Are any of the neopronouns gaining ground in a way that competes with singular they? No. Xe/xem/xyr/xyrs/xemself got about 9%, but to put that in context, traditional binary-gendered pronouns he/him and she/her both got entered by 30% of participants each. Pronouns are a closed class in English, which means it takes a very long time to add new pronouns, potentially even several generations. It could be a while before we see a neopronoun really permeate the nonbinary community in a lasting way.
In vaguely related news
This report was written on a new, more powerful laptop and powered by gratitude!
The Gender Census topped 44,000 participants this year, which means if the trend continues Google Sheets won’t be able to contain our magnificence. (Google Sheets has a 3 million cell limit and unfortunately we’re about to hit that.) I will have to use MS Excel next year, and because my existing hardware wasn’t powerful enough to process the statistics in Excel, a friend persuaded me to crowdfund for an upgrade. I’m nervous, because Excel is a lot less user-friendly to me than Google Sheets and I’m less familiar with the formulae, but this has been coming for a while and I’m going to have to do it sometime!
The promised “perk” for reaching the funding goal was the UK report for 2021, and we did indeed reach the funding goal (blimey), and I now have a beauuuutiful new laptop that can run big spreadsheets in Excel. It has improved my life in a lot of other ways too! So, I am grateful, and very happy to be here publishing the 2021 UK report.
Thank you very much, everyone. I hope this work helps make life a little easier for nonbinary people in the UK.
Footnotes
† I have also noticed (anecdotally) that there is an emerging theme of “gay/lesbian, not queer” in British anti-trans sentiment online. Queer is seen as trans-inclusive and transphobes are not into that.
External links
- All responses, unprocessed (UK only)
- Spreadsheet 1: Identity (UK only)
- Spreadsheet 2: Titles (UK only)
- Spreadsheet 3: Pronouns (UK only)
- Spreadsheet 4: Meta (UK only)
2021-11-09
email: hello@gendercensus.com