Contents
- Q1. Identity words
- Q2: Titles
- Q3: Pronouns
- Age and referrers
- Some of the questions this survey seeks to answer
- This year in review
- Closing thoughts
- Support me!
- Links to spreadsheets
I am very happy to welcome you to the report for the eighth international survey of people whose genders defy the binary.
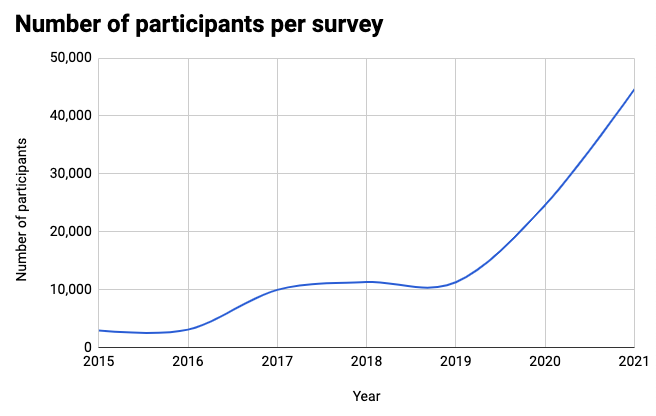
The survey took place for one month between 10th February and 10th March 2021, with 44,583 usable responses. It’s a community-based project that is not affiliated with any organisations, companies or academic institutions, so it was promoted entirely on social media and by word of mouth.
Before starting the survey, participants were required to check the following two boxes:
- Yes, I confirm that I don’t really fit into just one of the two boxes of “always, solely and completely a woman/girl” or “always, solely and completely a man/boy”.
- Yes, I understand that I can back out of the survey at any time before the end and my answers won’t be counted, and I understand that if I complete and submit the survey my anonymised response will be made publicly viewable.
You can read a much shorter summary of the main three questions here.
Q1. Identity words
This question is asked annually, and hasn’t changed much over the past several years. Participants were asked: Which of the following best describe(s) in English how you think of yourself? They had a choice of 30 identity words/phrases, plus “none/I do not describe myself” and “questioning/unknown”. Underneath the checkboxes there were 5 textboxes that invited participants to type extra words not otherwise listed. This question was optional.
Checkboxes
Here’s as many as I could comfortably fit on a graph:
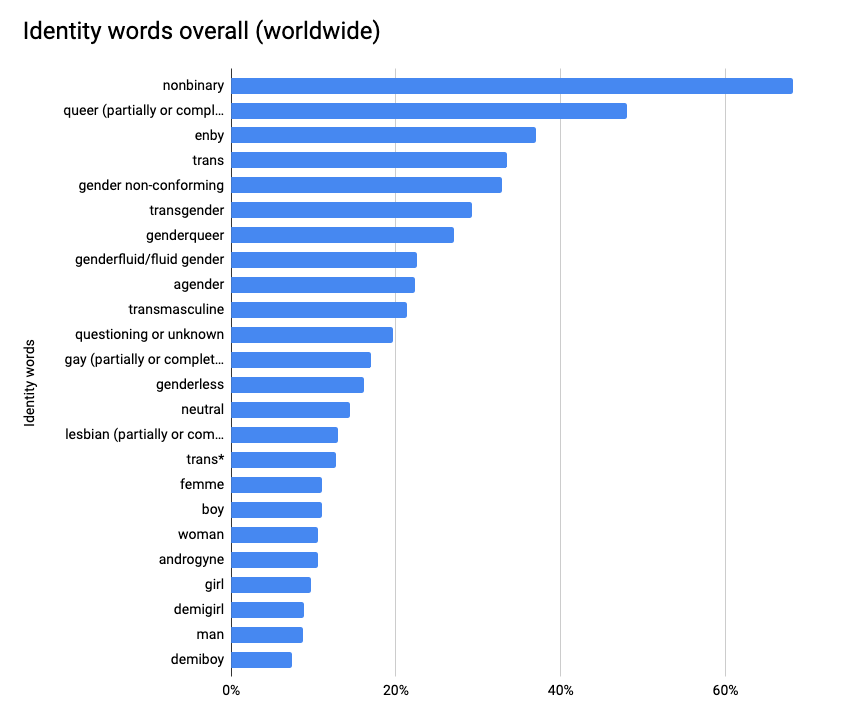
Here’s our top 5:
- nonbinary – 68.2% (up 1.8%)
- queer (partially or completely in relation to gender) – 48.0% (up 5.1%)
- enby – 37.0% (up 5.5%)
- trans – 33.5% (down 0.2%)
- gender non-conforming – 32.9% (up 3.9%)
It should be noted that this is heavily influenced by the ages of participants this year, because the survey was shared much more effectively in online social networks that tend to contain younger people.
The top 10 identity words are the same for the under-30s and over-30s, but the order is a little different:
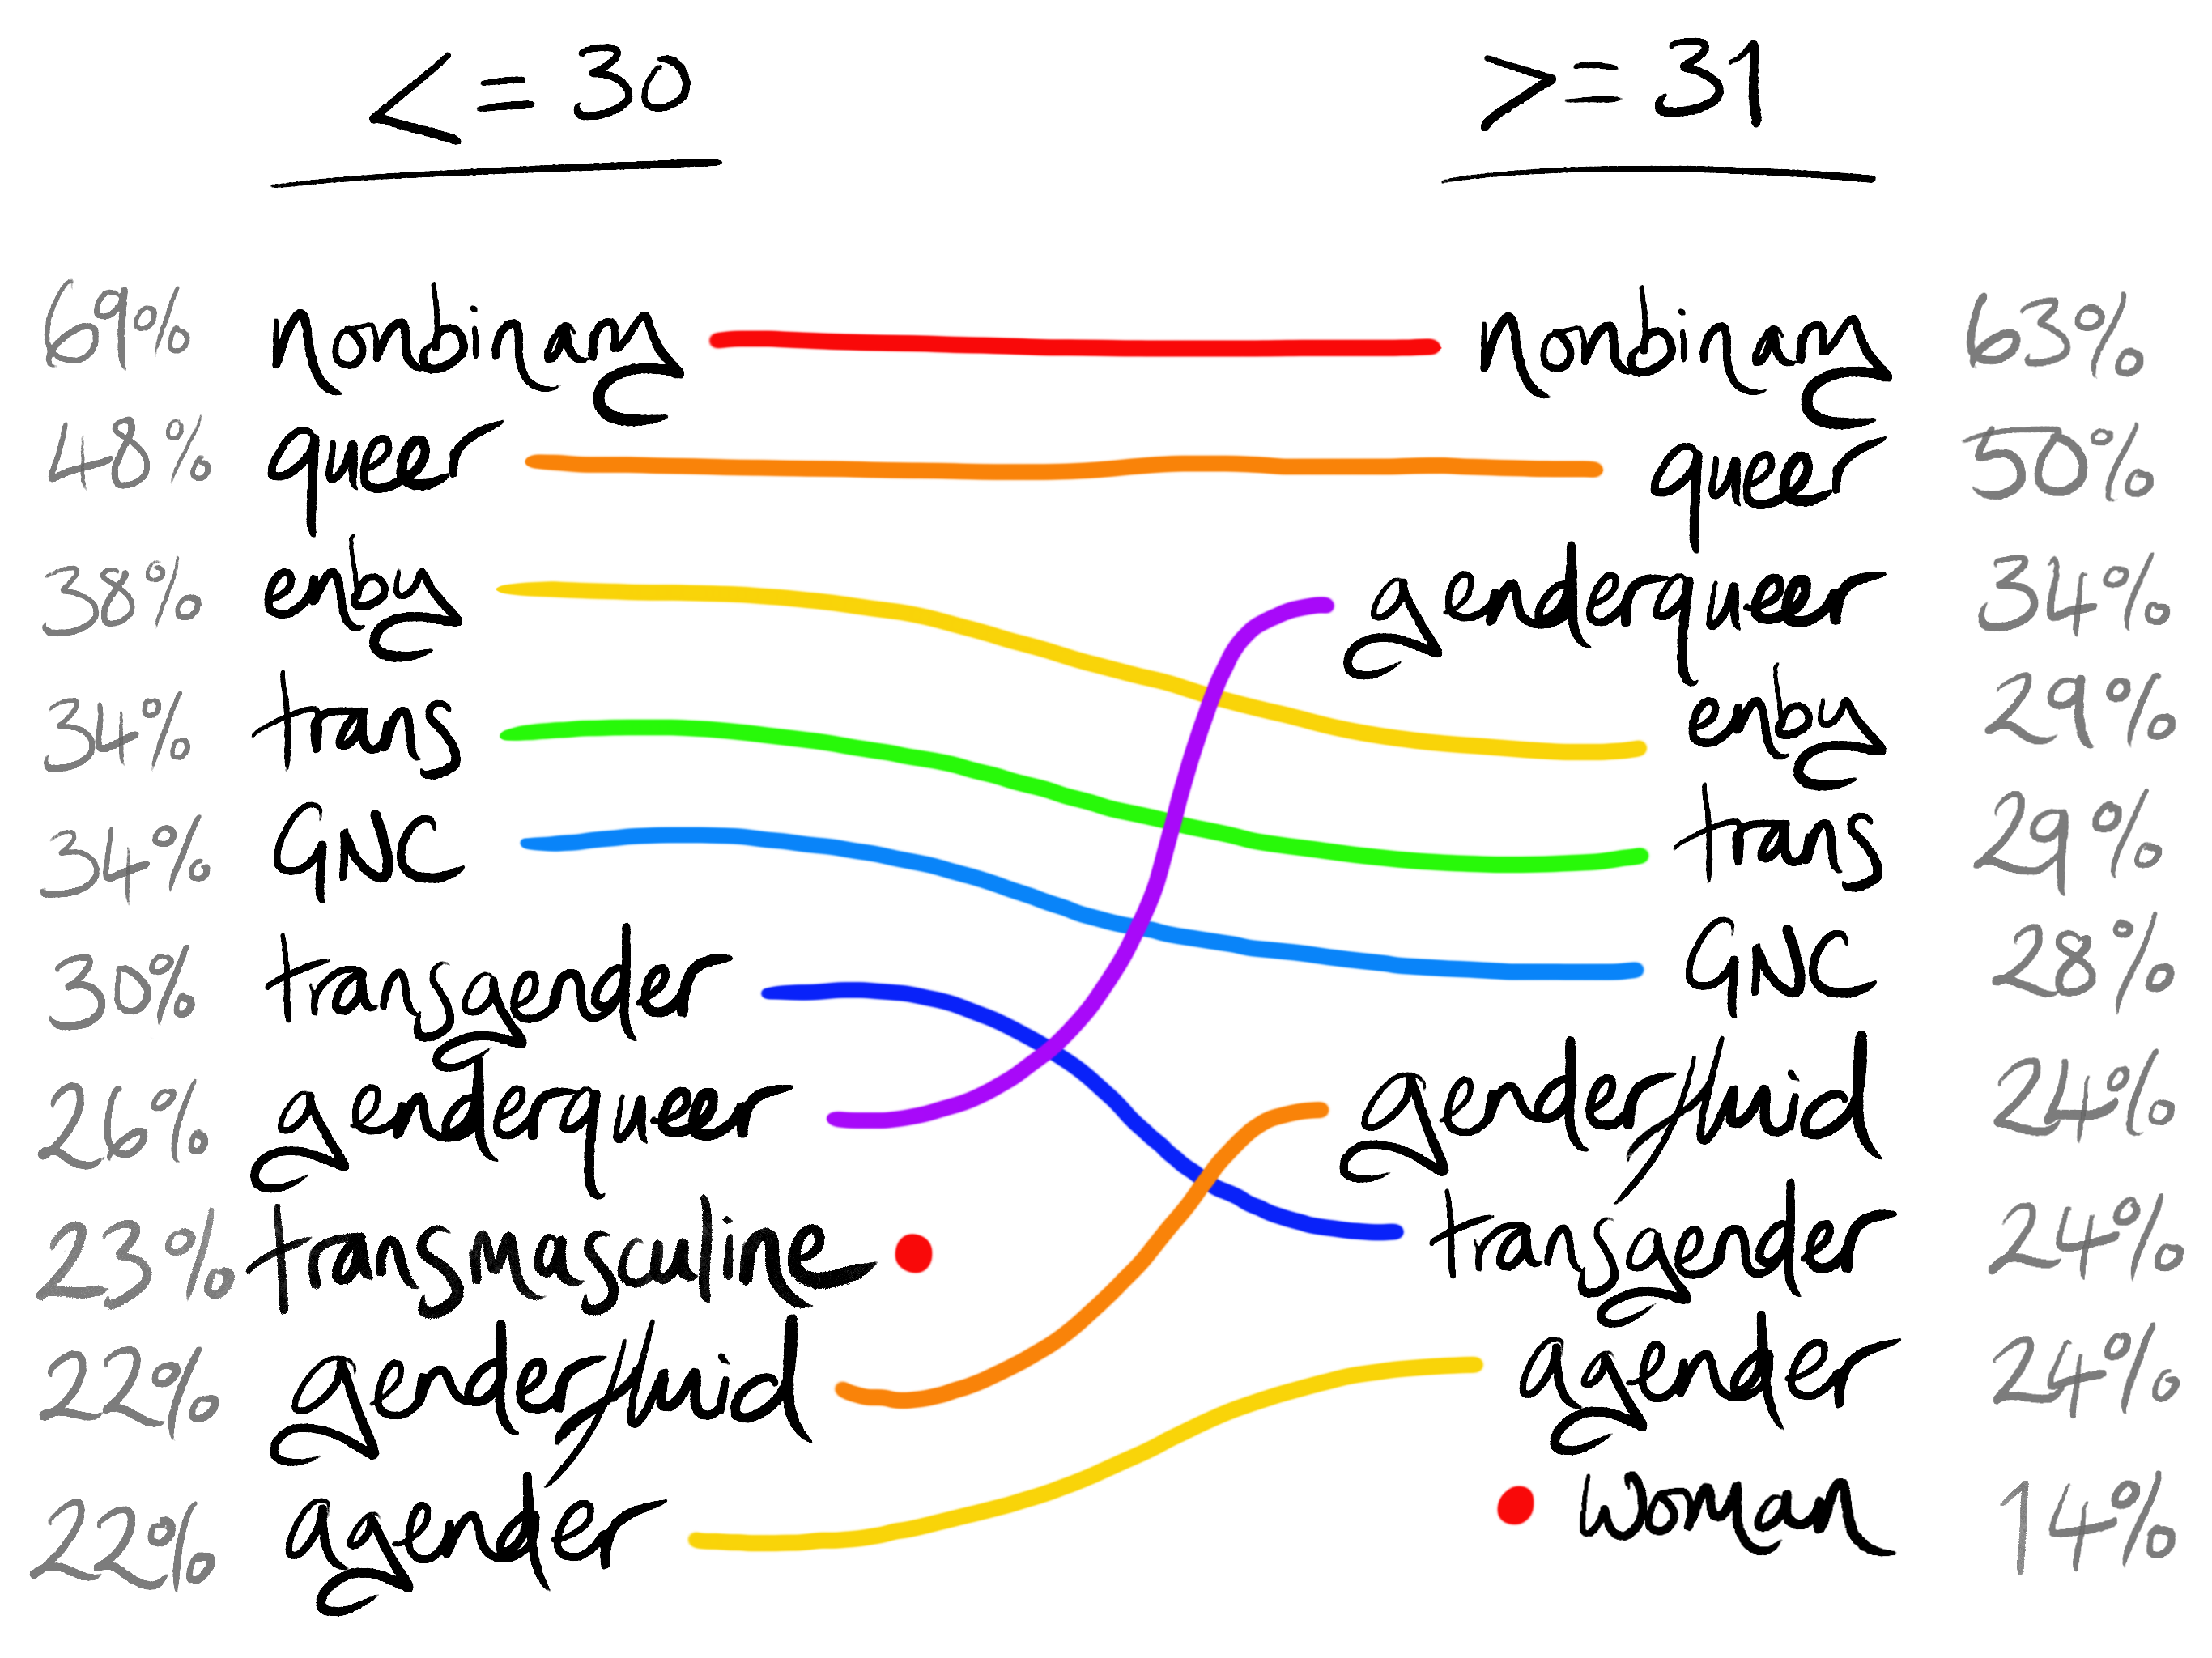
You can see that the order is pretty much the same, except genderqueer and genderfluid were chosen more often by the over-30s, whereas transmasculine scored low enough among over-30s that woman made it into the top 10 with only 14%.
Here’s our top 10 since 2015:
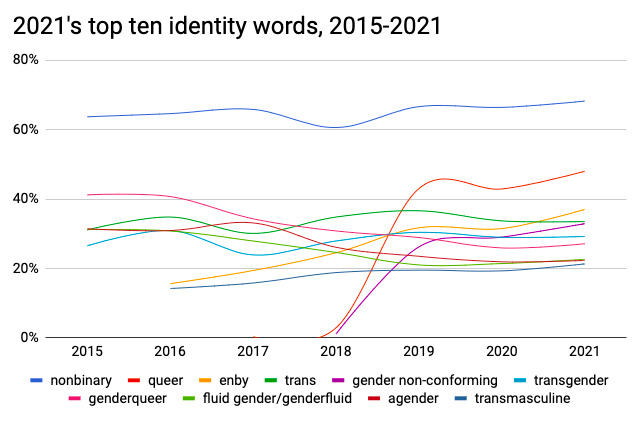
It’s a little difficult to see what’s going on, but the most notable trends I can identify are that enby has been consistently rising since it was added in 2016, and genderqueer has, despite its slight rise this year, been on a downward trend since the first survey in 2013.
This year three words were added due to being typed in by over 1% of participants last year: lesbian, butch and femme. I also added gay to correspond with lesbian, which is my usual protocol. (It’s why cisgender and binary are on the list despite being chosen very rarely year on year.)
Femme and butch both increased in popularity as checkboxes compared to type-ins only, which isn’t surprising. Butch rose from a little over 1% to 6%, and femme rose from a little over 1% to 11%. There were several comments in the feedback box asking why femme was in the list but masc was not, so I thought I should mention for the benefit of those people that femme isn’t short for feminine – it’s an experience/expression of femininity in its own right, historically queer-specific. It is often contrasted with butch, which is more masculine, but is also commonly a queer female experience.
Butch and femme are both words traditionally used to describe an experience or expression of gender, but the idea of lesbian as a gender identity was new to me, and I only added it this year because enough people specified “yes, lesbian is my gender, not just my sexual orientation” or similar that I realised I had to add it – and in order to keep the question clearly relating to gender, I added the qualifier (partially or completely in relation to gender) to both. Since then I have learned that lesbian as a gender is not a new idea.
Interestingly, gay as a gender identity was entered very rarely last year, and I only added it this year to complement lesbian, but this year as checkboxes gay was chosen more often than lesbian among both over-30s and under-30s. I love to be taken by surprise like this! Perhaps lesbians are more likely to be previously aware of the way their sexual orientation and gender intersect, but when prompted by a checkbox more people identify with gay in terms of their genders because gay has mostly been used in a more gender-neutral way? A woman can call herself gay and it’s assumed that she is homosexual, i.e. attracted to people of the same gender, whereas if a man calls himself a lesbian it is assumed he is attracted to women and experiences womanhood in some way; if this were not the case we might expect lesbian and gay to be chosen by a more similar proportion of respondents.
I was also asked in the feedback box why lesbian and gay were included in the checkbox options but bisexual was not. Last year I considered this and concluded that I wouldn’t add it, because bisexual does not carry gender connotations in the way that lesbian and gay usually do, and in any case it was not typed in by any participants at all in 2020. This year, despite some participants complaining that it was missing, it was typed in by only 0.5% of participants. Although that does rise to 0.7% if I include more spelling variations, it still doesn’t make the 1% boundary.
This year one checkbox term was entered by under 3% of both under-30s and over-30s: neutrois. Removing it from the checkbox list next year will be a strange feeling, as one of the first nonbinary bloggers I ran into was Micah of genderqueer.me, who is neutrois and whose resources on nonbinary transition have long been well-known and invaluable.
This year was the first year I removed a term from the checkbox list for this question: third gender. The threshold for being removed as a checkbox option was “below 3% among both under-30s and over-30s”. It was a little nerve-racking to take a leap and see whether I had messed up, but this year third gender was typed into the textboxes by only 27 people, which I find reassuring! I would rather err on the side of keeping checkbox words in the list, in order to avoid alienating people in under-represented groups. If anything, 27 entries out of 44,000 (0.06%) suggests to me that perhaps the threshold might be a little bit too low.
I like the idea of experimentally increasing the removal threshold to 4% to see whether it works better, but aside from neutrois nothing else was chosen by under 4% of participants, which makes the outcome a little too unpredictable for my liking. I will keep the 3% removal threshold for the time being, and reconsider it next year.
Write-ins
There were 7,994 unique textbox entries this year, which is one for every 6 participants. 1,748 of those were entered more than once.
Only two words were typed in by over 1% of participants in at least one of the two broad age groups this year.
Based on exact complete textbox entries (i.e. without taking into account spelling variations or superfluous words), the first is person (among over-30s). Every year a lot of people type in versions of this idea: I’m just me, human, just [my name], etc. Now that one of them has unequivocally risen above 1% I am left with the uneasy task of deciding whether to add it as a checkbox option. To my mind these are ways of not describing one’s gender at all (“none/I do not describe my gender”), which is on the list already – but clearly for many people there is a subtle difference that they want to express in a slightly different way. One of the reasons I don’t feel able to dismiss it immediately is because it was popular among over-30s, who are the less represented group. I need to think about this a little more before I make a decision. Your thoughts are very welcome, do get in touch if you feel you can present me with a helpful perspective!
The second to meet the 1% threshold criteria is actually a part of a term/phrase that I noticed appearing frequently: void. I counted all instances of someone typing in something involving the word void and it went over 1% among the under-30s. Here’s how the top 5 entries looked:
- gendervoid – 226 (0.51%)
- void – 188
- voidgender – 40
- voidpunk – 25
- gender void – 16
In total there were 68 unique ways participants entered the word void – on its own, in a phrase, or as part of a larger word/term. 15 of these were entered more than once. Overall, terms including void were entered by 1.4% of under-30s and 0.9% of over-30s, which is quite a lot for a textbox entry. I will be adding the most popular variant, gendervoid, to next year’s checkbox options in the identity question.
Overall
The most common number of identity terms chosen or entered was 4 (11.8%). Here’s a graph that shows you the distribution:
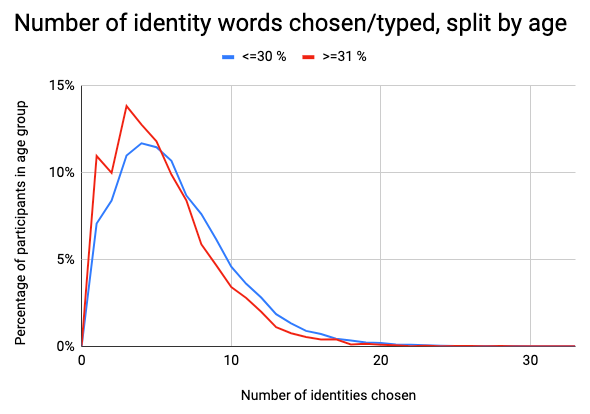
The distribution is roughly the same shape across the two age groups, but with over-30s generally choosing/entering slightly fewer terms each overall.
Unrelatedly, this year I noticed an uptick in the number of people censoring their identity words. I recently blogged a sort of PSA about this here. I will add a brief clarification to next year’s survey, asking people not to censor their identity words.
Q2: Titles
Participants were asked: Supposing all title fields on forms were optional and write-your-own, what would you want yours to be in English? There were several specific titles to choose from, plus some hypotheticals, no title at all, “unknown”, and “I choose on the day depending on how I’m feeling”. This question was optional, but unlike the others it restricted people to one answer only, because on any given form asking for personal details only one title would be possible per person.
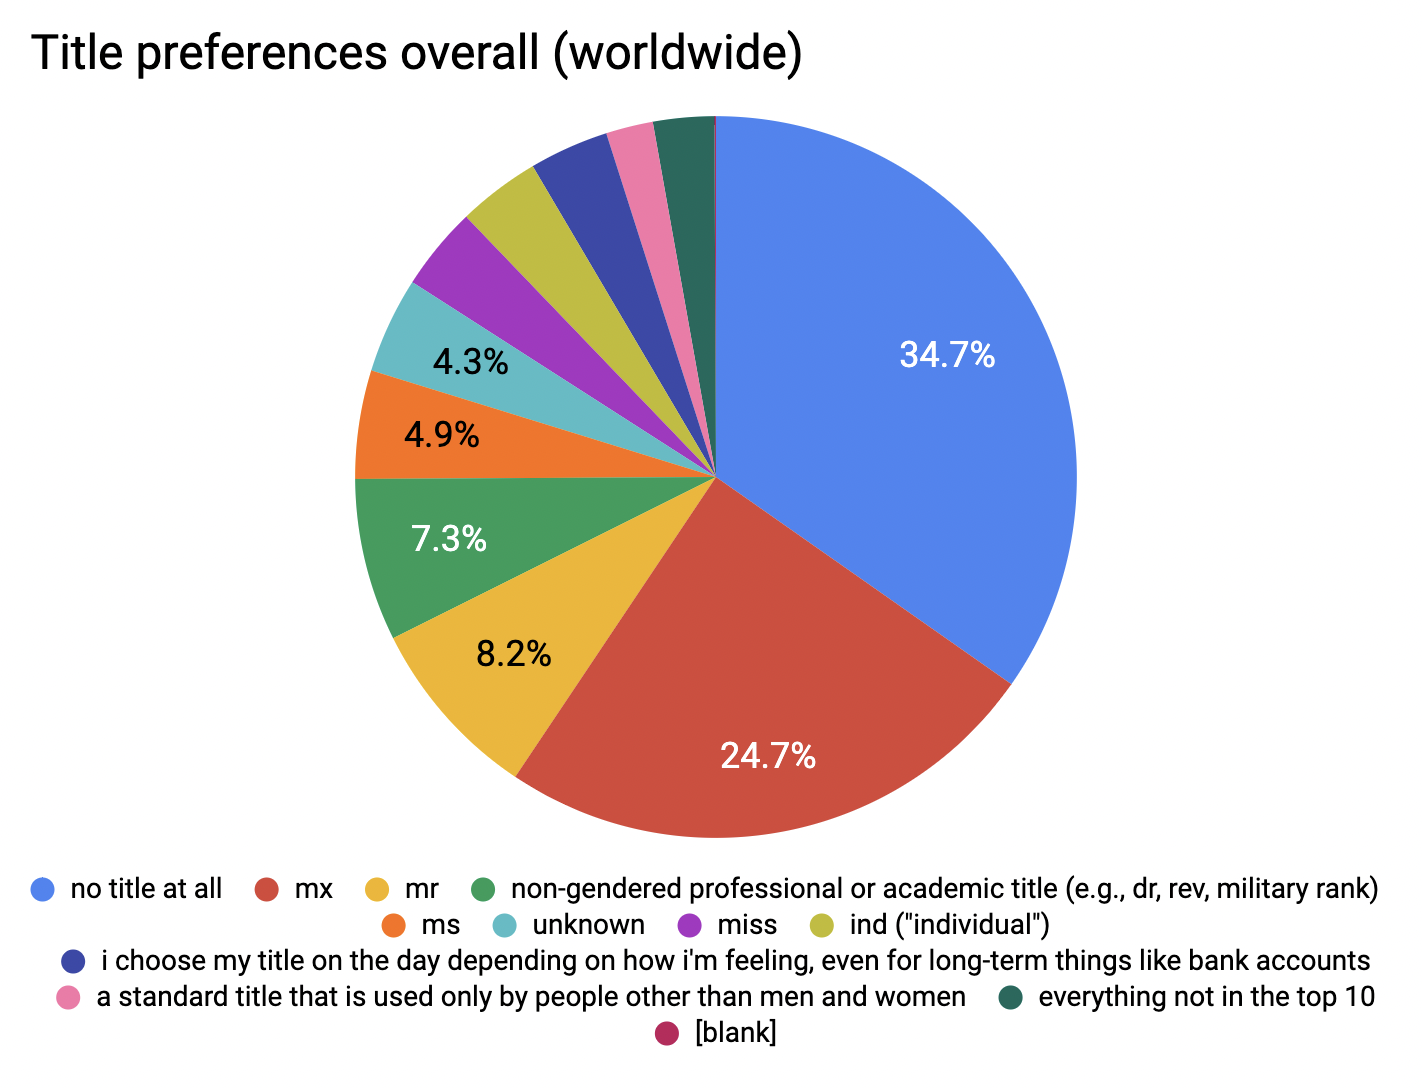
Here’s this year’s top 5:
- No title at all – 34.7% (up 0.3%)
- Mx – 24.7% (down 3.3%)
- Mr – 8.2% (down 0.4%)
- Non-gendered professional/academic title – 7.3% (up 2.0%)
- Ms – 4.9% (no change)
Here it is split by age group:
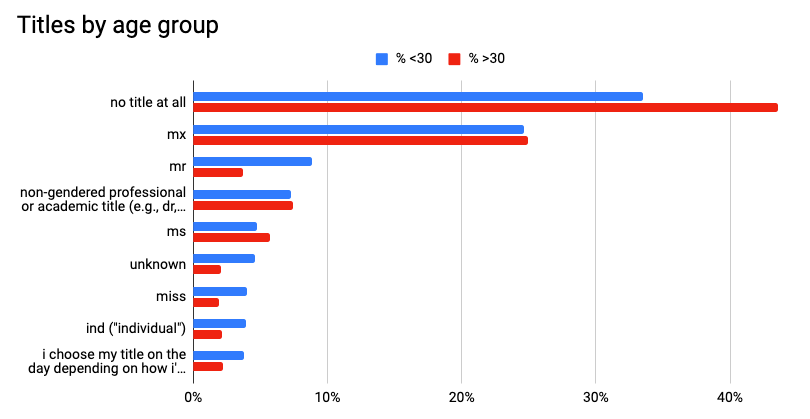
Generally speaking, the younger participants were more likely to go by specific and often gendered titles like Miss, Mr or Ind, and more likely to choose depending on how they felt at the time, and the older participants were more likely to ditch titles altogether.
Here’s title popularity over several years:
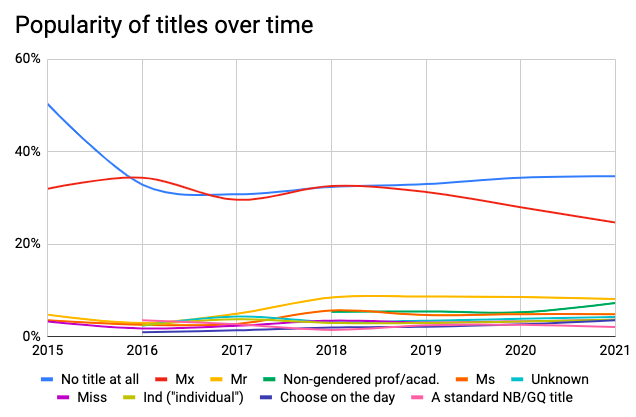
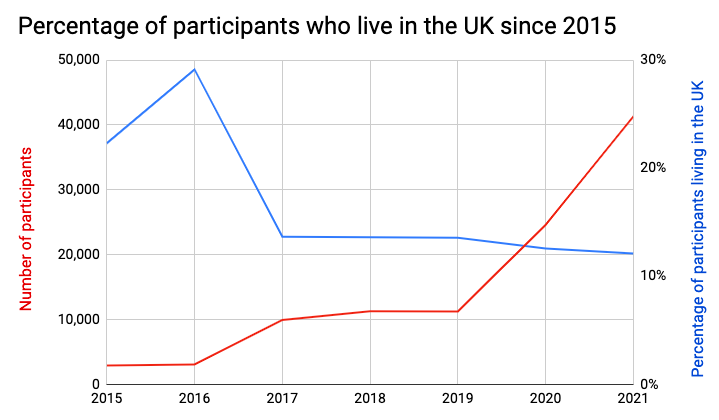
As we saw last year, the popularity of Mx seems to be decreasing, but it also matches the shrinking proportion of participants from the UK. Anecdotally, Mx is more well-known and well-established in the UK, so that may be a factor.
The title graph above is a little bit hard to read just because Mx and No Title are so popular and everything else is crowded at the bottom, so here’s a graph of the top 10 without Mx and No Title:
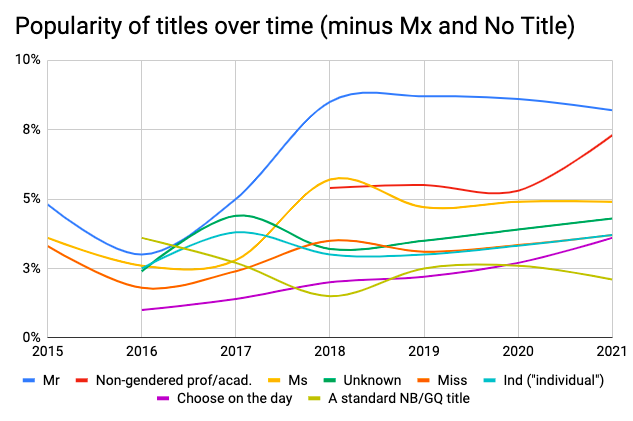
Nothing breaks 10%, and everything is in the same order as last year, with a notable boost for the professional/academic titles – that’s Doctor, Reverend, Captain, Professor, etc.
The top 5 type-ins:
- M – 194 (0.4%)
- Sir – 46
- Mrs – 45
- Comrade – 26
- Ser – 15
M takes a sizable lead there, but still not quite enough to make the radio button list.
Since we’ve found that Mx is generally considered gender-inclusive (anyone of any gender can use it), I am always wondering whether we yet have a standard title that generally denotes/expresses a nonbinary gender, in the same way that, for example, Ms generally denotes/expresses a female gender. For this reason, participants who choose “a standard title that is used only by people other than men and women” are taken to a separate question asking if they know of any. 85% of the over 900 people who chose the gender-exclusive title option left the textboxes blank, but here’s the top 5:
- Mx – 44 (0.1%)
- Person or Per – 13
- M – 13
- Ser – 9
- Ind – 7
I worry a little bit that I have somehow designed the question in such a way that respondents are confused, since some of the entries this year are either gender-inclusive titles that are already limited in some other way (such as “Captain” or “employee”), or are established identity words that are too general or too specific (such as “transgender” or “demigender”). This is fairly representative of previous years with this question too.
Often there are only a handful that even get mentioned more than once, so this is a little better than usual, but I think it’s safe to say that nothing is pulling into the lead yet.
Q3: Pronouns
The pronouns question was split into two sections, as usual. The first invites you to choose from a checkbox list of 13 options. One of the checkboxes is “a pronoun set not listed here”, and if you choose that it takes you to a section where you can enter up to five new pronoun sets in detail. All questions about pronouns were optional.
Checkboxes
The initial icebreaker was: Supposing all pronouns were accepted by everyone without question and were easy to learn, which pronouns are you happy for people to use for you in English? Participants could choose as many of the checkboxes as they wanted. Checkboxes included various common and uncommon pronoun sets, plus options like “any”, “avoid pronouns”, “mix it up” and “questioning or unknown”.
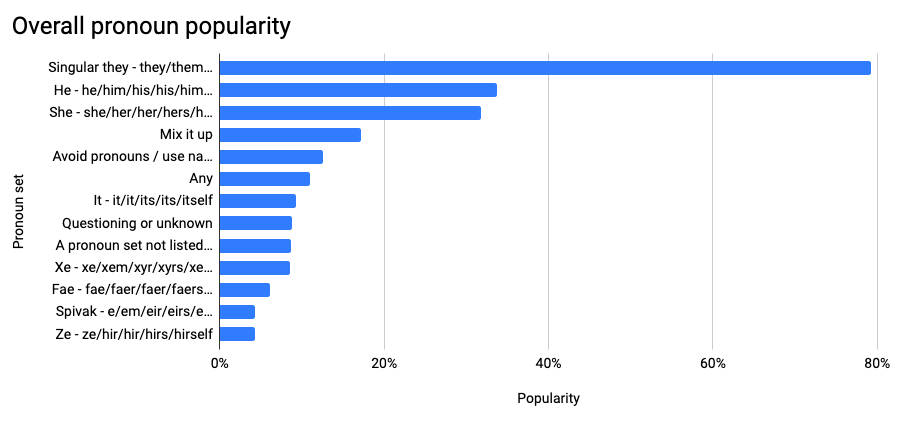
The top 5 pronouns (or lack thereof) selected were:
- Singular they – they/them/their/theirs/themself – 79.2% (up 1.7%)
- He – he/him/his/his/himself – 33.8% (up 3.3%)
- She – she/her/her/hers/herself – 31.7% (up 2.7%)
- None/avoid pronouns – 12.6% (down 1.1%)
- It – it/it/its/its/itself – 9.3% (up 3.7%)
Singular they was selected more often than the next three specific pronoun sets (he/him, she/her and it/it) combined. 9.8% of participants weren’t happy with he/him, she/her or singular they. This is slightly higher than last year’s 9.1%.
Some of the up/down shifts are affected by the age distribution of participants. The proportion of participants age 31 or older was smaller than usual, so anything preferred by younger participants has had a bit of a boost, and anything preferred by the over-30s seems to have reduced in popularity.
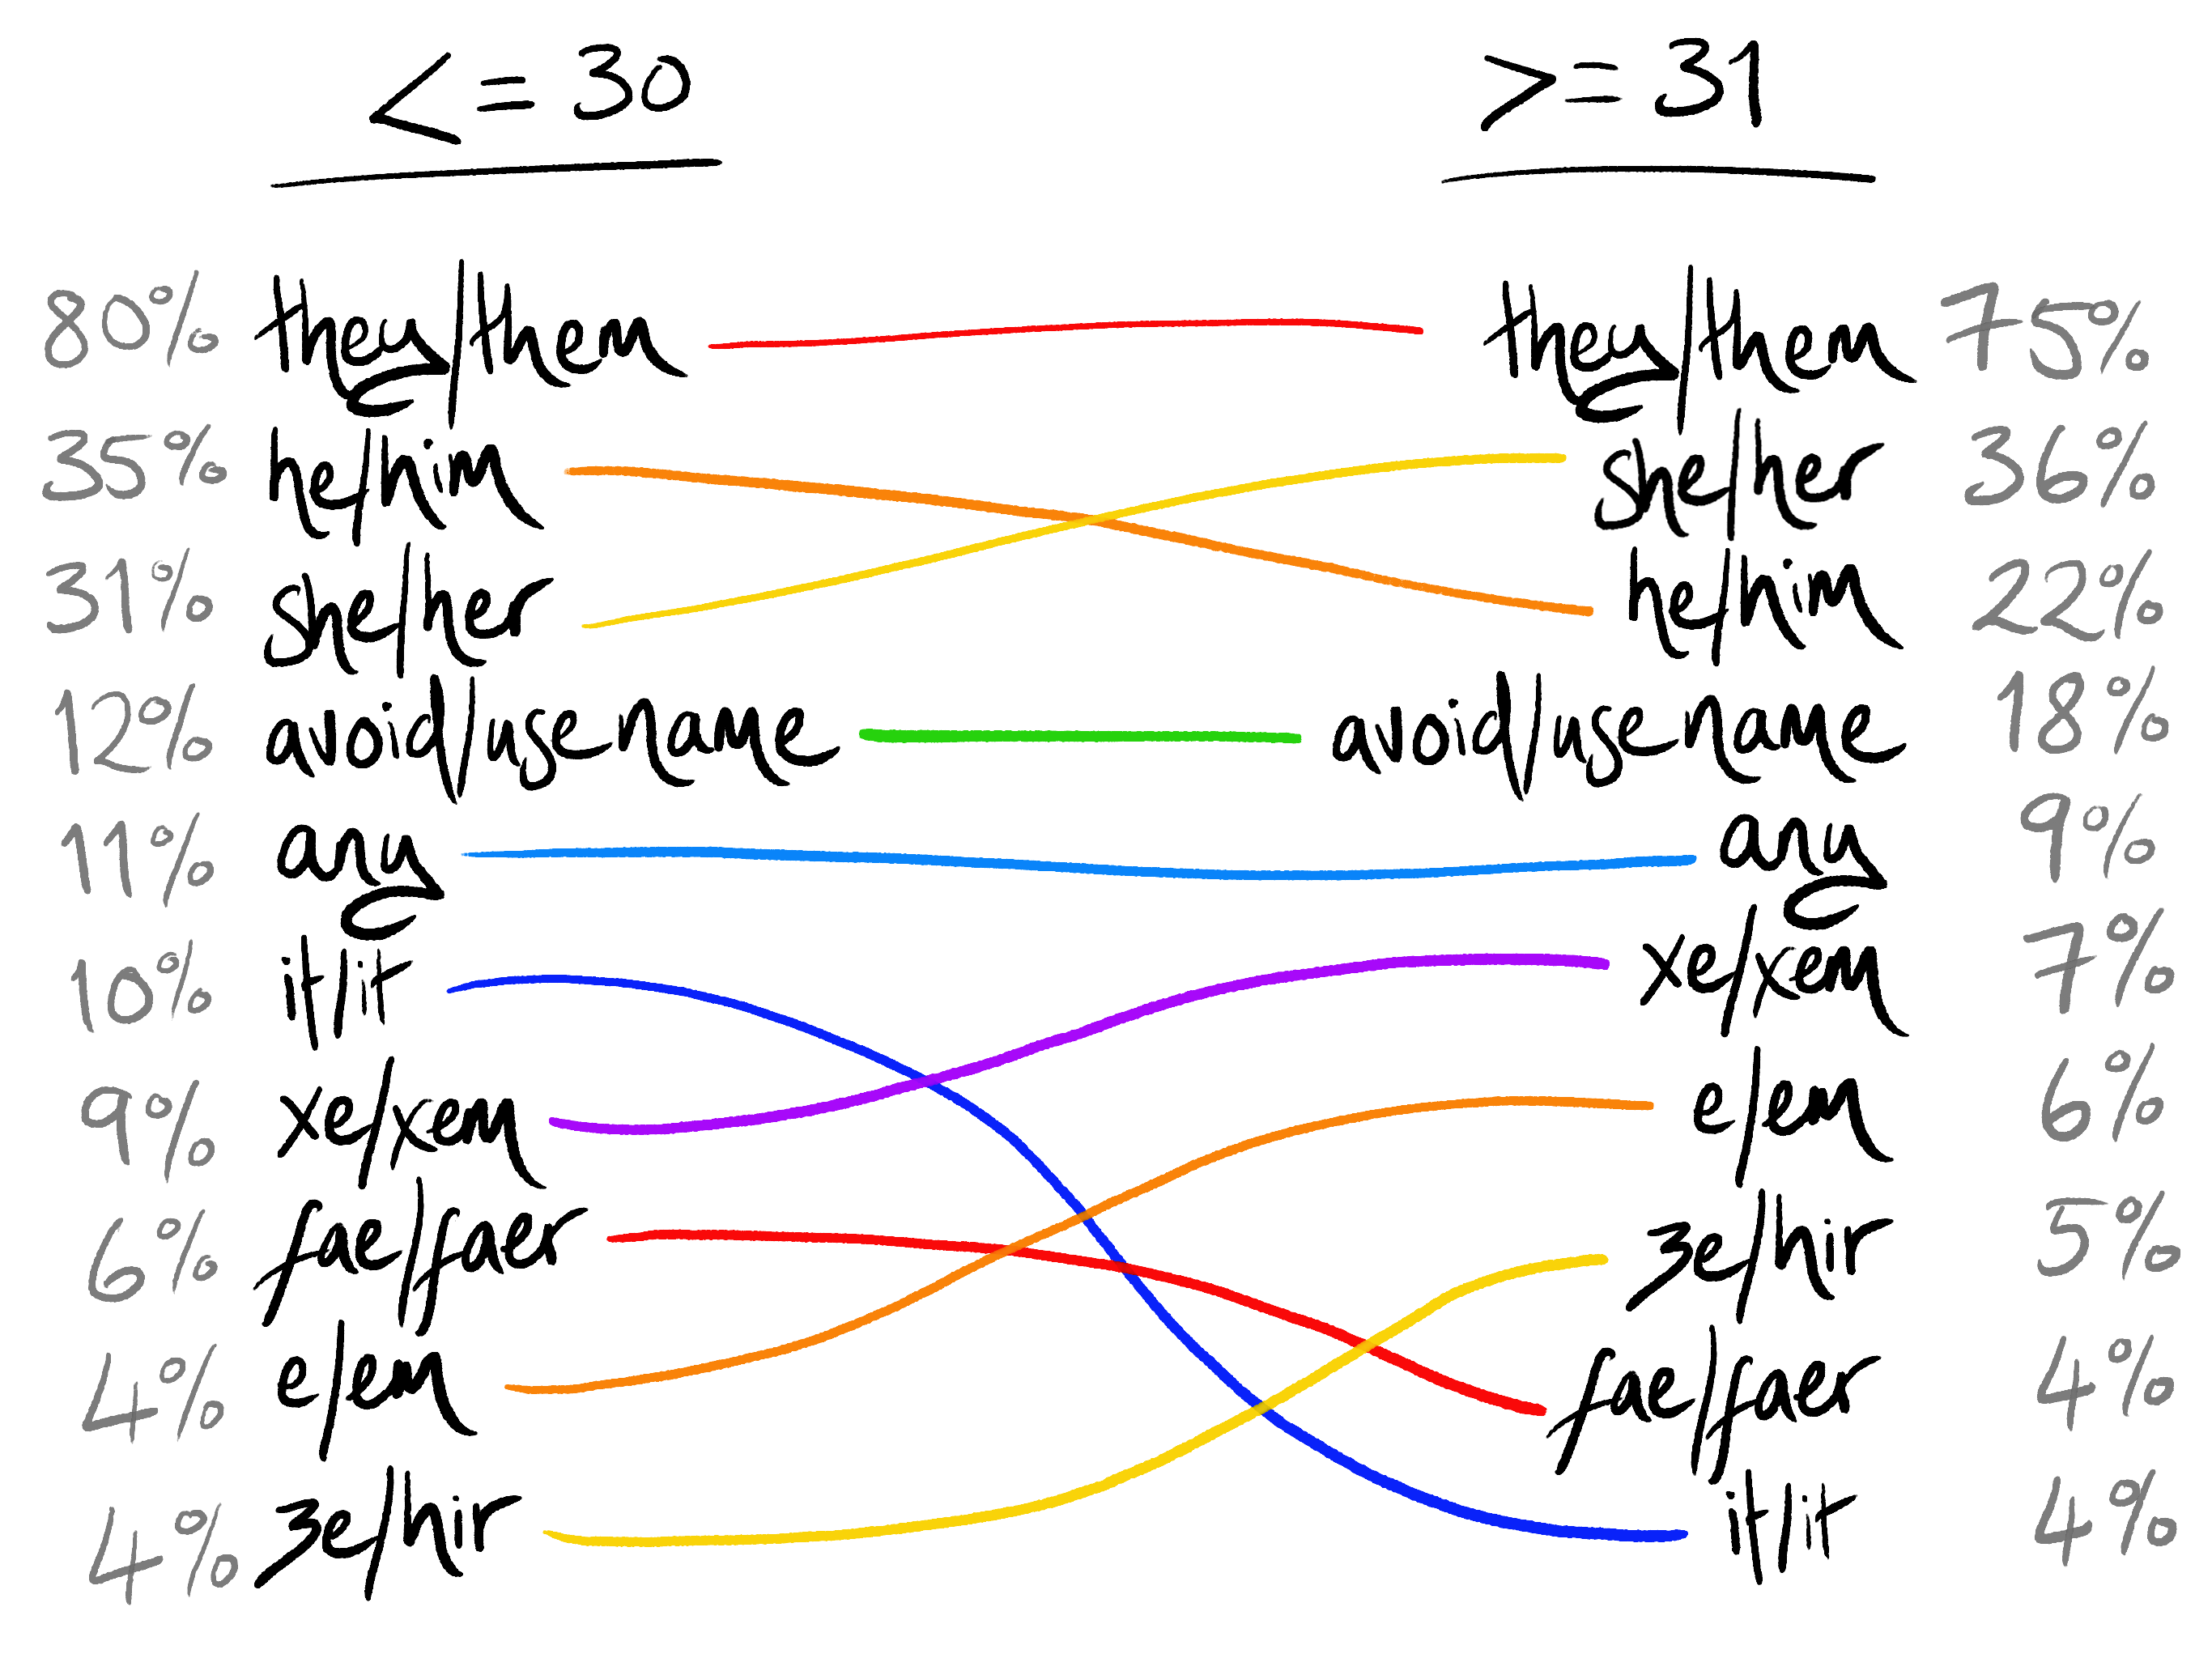
Here’s the comparison of pronoun popularity between age groups, ordered by the average popularity of the under-30s and over-30s:
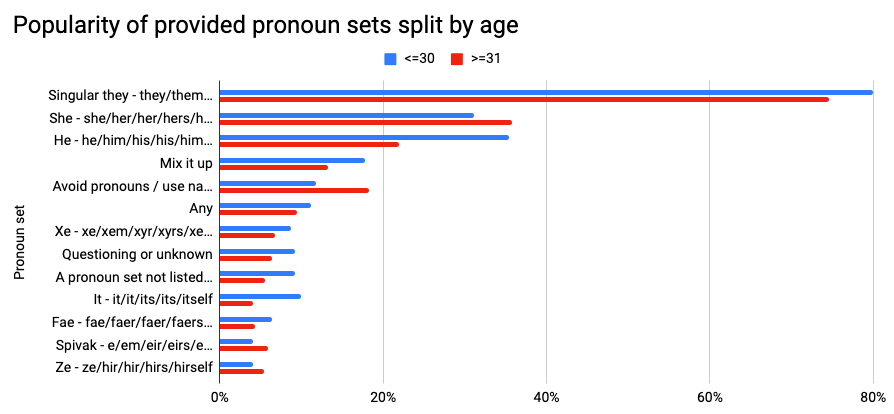
There are a few predictable results – participants in the younger age group are more likely to say they are questioning or don’t know what their “happy” pronouns are, and the longer-established neopronouns e/em (Spivak) and ze/hir are more popular in the older age group. There are a few things that raise my eyebrows in the fascinated kind of way, too, like that under-30s are way more likely to be up for he/him, and twice as likely to be okay with it/it. Also interesting to note that avoiding pronouns is preferred among the over 30s, whereas under-30s are more likely to be happy with a neopronoun set that isn’t listed.
Almost 4 in 5 participants liked singular they in both age groups, and that’s up in both age groups too – under-30s have gone from 79.2% to 79.9% since last year, and over-30s have gone up from 67.3% to 74.6%, which is actually a pretty big jump!
Here’s the top 10 since 2015:
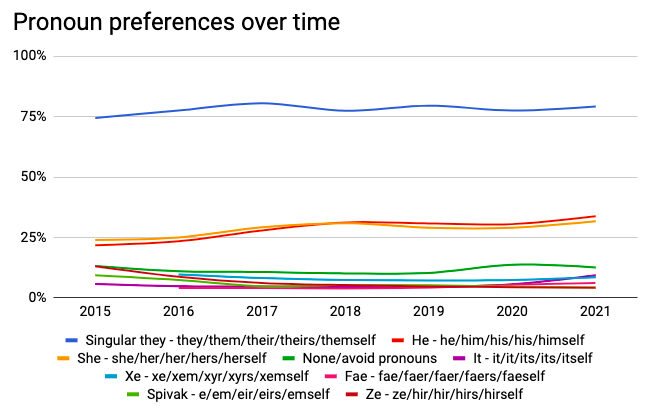
Singular they has leveled out, more or less, but it looks like she/her and he/him might be on the rise? Whether they’re genuinely becoming more popular or whether it’s down to sample biases (participants from more different countries, participants younger than previous years overall) remains to be seen, but in a few years we’ll have more information.
Let’s remove he/him, she/her and singular they so that we can see the other options more clearly:
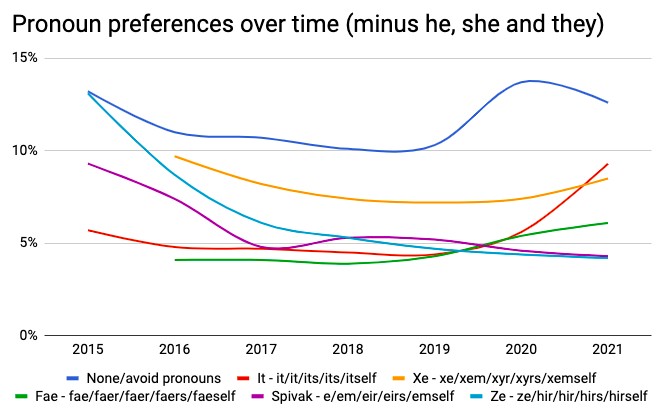
Whoa, look at it/it go! 🚀 I’m a bit sad about the decline of ze/hir, it’s the first neopronoun I learned about. Some people in the feedback box asked me if I had accidentally misspelled the ze/zir pronoun set, which made me feel very old.
People are more selective about their pronouns than they are about their identity words:
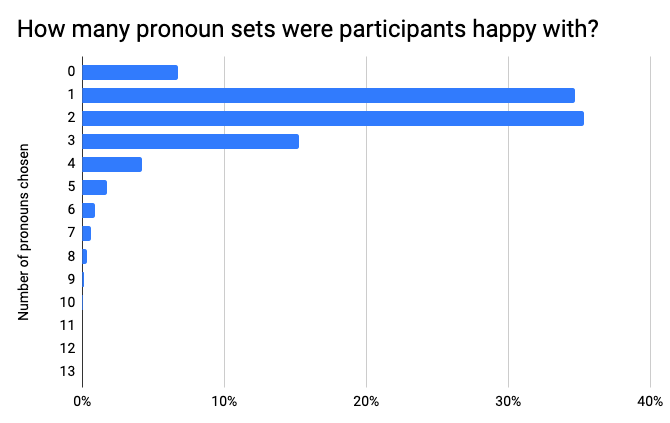
That’s 1.9 pronoun sets per person on average. The most common number of pronoun sets was 2, but it was very close – almost as many chose only 1. If you include write-ins, this is how it looks when split by age group:
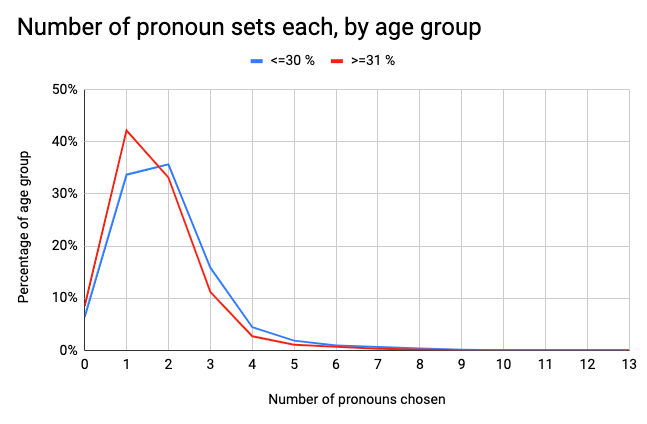
You can see that although over-30s were quite a lot more likely to choose/enter only one pronoun set, the large proportion of younger participants and their tendency to choose more pronoun sets each pulls the average up.
Every pronoun set in the checkbox list was comfortably chosen by over 3% in both age groups, so they all stay in the game.
Neopronouns
The most popular neopronoun overall was in the checkbox list: Xe – xe/xem/xyr/xyrs/xemself (8.5%, up 1.1% on last year). That makes sense, because anything in the checkbox list is selected a lot more often than anything that is written into a textbox.
The write-ins is where things get interesting! Participants were guided through entering each of the 5 forms of their pronoun set, so that we can know exactly how to use it. 9.2% of participants under 30 selected “a pronoun set not listed here”, whereas only 5.5% of participants over 30 did so.
Here’s our top 5 write-ins (counted by subjective/objective only):
- ey/em – 0.59% (262 participants)
- ae/aer – 0.44%
- they/them – 0.38%
- ve/ver – 0.26%
- ze/zir – 0.22%
That’s the same as last year, and in the same order.
Some of those they/thems are people who somehow missed singular they in the checkbox list and are entering it again, which is reasonably commonish even with pronouns like she/her and he/him. But a lot of them were participants entering plural they – it’s just they when referring to multiple people, exactly the same as singular they but the reflexive is themselves rather than themself.
I count neopronoun write-ins by the first two forms in the set only, because I find that there are more spelling variations after those two forms, and it’s a fairly easy way to group them to identify which sets (or sounds!) are roughly more popular. (More on that here.) If a set reaches 1% when counted in this way, I add it to the checkbox list using the most popular spelling combination. So this year’s most popular, ey/em, would look like this: ey/em/eir/eirs/emself (singular verbs) This set is an established variant of the Spivak set, known as Elverson. It was the most popular typed-in neopronoun last year too, also with 0.6%. Here’s an example of how it would be used in several sentences:
I’m in a coffee shop with my friend Sam. Ey is buying emself a coffee in eir reusable takeaway cup. “Is this your coffee?” the barista asks me, holding up Sam’s coffee. “No,” I reply, pointing to Sam, “it’s eirs.”
Nothing in the type-your-pronouns section reached 1% this year, so nothing will be added to the checkbox list.
Now for some fun trivia? 2,319 unique pronoun sets were entered (based on subj/obj/reflex only), of which 539 were entered more than once. That’s one new pronoun set per 19 respondents.
And finally! I really liked this feedback that someone left about neopronouns:
“I’ve seen a few people saying that in the 2020 Gender Census results, you wrote something about neopronouns reaching a “consensus”. I wanted to say that the point of neopronouns isn’t to reach a consensus! Neopronouns as a concept serve a purpose directly contradictory to the concept of a pronoun consensus. … If you’re getting a lot of varied results in neopronoun fields, that’s not a sign of disagreement, that’s just how neopronouns work! :D”
First of all, I would like to dispute the idea that neopronouns are “directly contradictory to the concept of a pronoun consensus”. This might be true in the experience of this participant, but it is not universal. Several neopronoun sets over the decades were expressly created in order to replace all gendered pronouns and do away with sexism, and several were created in order to represent what we would probably now call nonbinary people, but the most common reason I find when researching is simply as a gender-neutral singular third-person personal pronoun to be used when talking about a non-specific individual – created by people who feel that singular they is ~ungrammatical~ or whatever. (Perhaps the participant quoted above was thinking about nounself neopronouns specifically?)
Having said all of that, I do understand that some communities online use neopronouns in a more fast and loose kind of a way. At the same time I am writing for a broad audience so I also need to think like someone on the outside looking in.
- Neopronouns can be kind of like names, in that some people have totally unique names and some people have very common names, lots of people go by different names in different contexts (friendly nicknames vs. professional work names), etc. I also appreciate that where nouns are an open class in English (new words can be created and used fluently on the fly), pronouns are a closed class (new pronouns are added to the English language very rarely and are comparatively hard to learn). What people who use multiple sets of neopronouns are trying to do, essentially, is change pronouns in English from a closed class to an open class, which is actually very punk and I love it.
- When someone who is cisgender and binary comes along and starts learning about nonbinary people, they are going to find out that a lot of us don’t feel like men or women. One of the first questions they’re going to ask is, “so if I don’t call you he or she, is there, like, a nonbinary version of that?” And while it is obvious to us that there’s not a single pronoun that successfully covers all nonbinary people and only nonbinary people, that is something that we know because of surveys like this. It is helpful to have data to confirm things that we already know about, and if a new “nonbinary” pronoun starts to emerge I want to watch that as it happens.
Age and referrers
Participants were asked for their age, and answers were grouped in 5-year increments. This question was optional, and only 61 participants (0.14%) left it blank. The older you are, the less well represented on the internet you’re generally likely to be, and anecdotally I’ve found that people are less likely to participate if they don’t feel represented by the checkbox options. So the age question lets us see how we can keep representing people in older age groups.
Participants were also asked where they found out about the survey just before taking part. This was also optional, and only 37 participants (0.08%) declined to answer. The answers to this question can be combined with age info to show me where to focus “promotional” energy to get as varied a sample as possible.
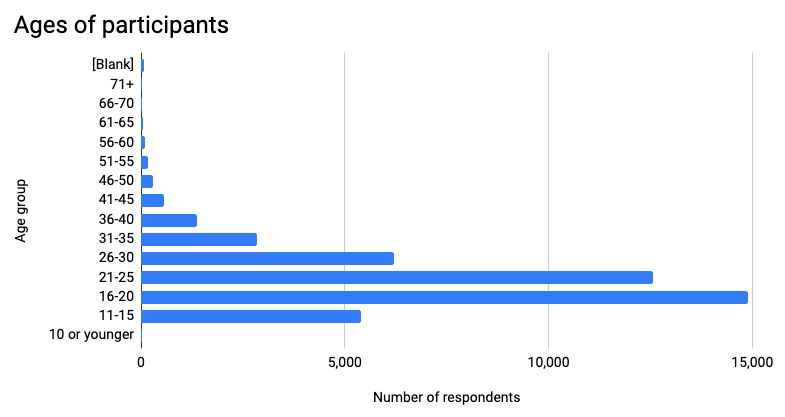
12.2% of participants were aged 31 or over, which is 2.3% less than last year. (In the general population of the UK that figure is more like 62%.) I’ve mentioned this in previous reports but it’s worth repeating: The age distribution of participants in this survey does not indicate that younger people are more likely to identify as trans. In order to support that hypothesis you would need to survey the general population, and this survey very deliberately does not survey the general population. The age distribution of participants in this survey is largely representative of the memberships of social networks where the survey URL is shared.
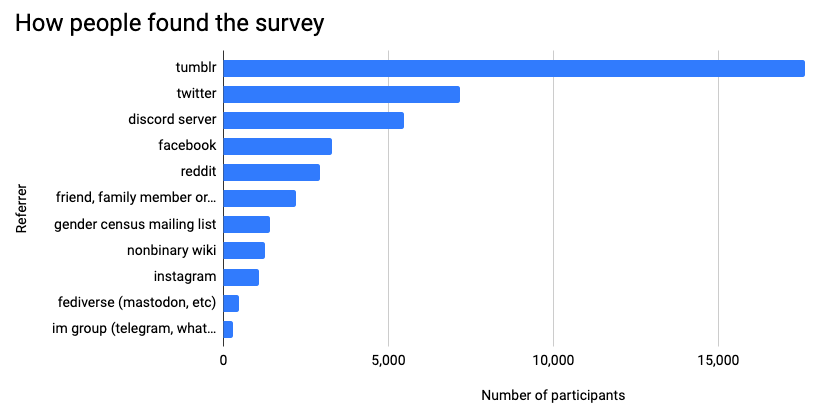
The top three sources were responsible for 80% of participants:
- Tumblr – 39.5%
- Twitter – 16.1%
- Discord server – 12.3%
The number of respondents coming from Tumblr was greater than than next 3 most popular places combined, and Tumblr users were a larger proportion than last year too. Tumblr has a killer combination of great sharing mechanisms and a well-established trans community, and when you add our loyal followership of several thousand you can see how, with very little effort, the promotional post on Tumblr was reblogged almost 11,000 times. Rather than Tumblr creating trans people, I speculate that trans people are more likely to join and stay on Tumblr, so the overrepresentation isn’t worrisome in itself, but I will continue to seek out more ways to promote the survey elsewhere.
On the subject of participants overall being younger this year, we do have a correlation that could explain it somewhat.
- Last year 33% of participants came from Tumblr and this year it had grown to 40% (up 7%). Tumblr users tend to be younger.
- Last year 8% of participants came from Discord, but this year it was more like 12% (up 4%). Discord users tend to be younger.
- Respondents from Facebook have gone down from 15% last year to just 7% this year (down 8%). Facebook users tend to be older.
So based on where younger and older people tend to hang out and how easy it is to share socially on those platforms, it makes sense that we’d have more younger participants this year.
I remain open to suggestions for ways to get the word out among LGBTQ+ people over the age of 30. I feel good about the flyers that supporters can print out and leave in LGBTQ+ community hubs, but this year thanks to the coronavirus pandemic many community groups have been unable to meet in person and many hubs have been closed. My design skills are somewhat lacking, so perhaps they need a little work!
The Gender Census mailing list has grown since the survey opened, and it now stands at around 4,500. The TinyLetter limit is 5,000 so I will switch to MailChimp and a paid service before the next survey. The mailing list continues to be a reliable way to prompt older participants when the survey opens, emails can be forwarded to like-minded friends, and I have enjoyed writing progress reports while the survey was open over the last couple of years! So I feel it’s a good idea to continue.
Some of the questions this survey seeks to answer
- What should the third gender option on forms be called? – Nonbinary was chosen by around two thirds of participants, and its use has been steady and increasing for many years. That leaves one in three who don’t identify as nonbinary, but there are no other comparably popular words in the top 10 that are unambiguous in meaning. I would recommend the third gender option be called nonbinary, and future surveys will monitor this issue closely.
- Is there a standard neutral title yet? – Mx is far and away the most popular gender-neutral title, but at only about one quarter of participants. Internationally, participants preferred to not have any title at all by a significant margin. Those designing forms collecting personal information must ensure that Mx is an option alongside Mr and Ms, but it is more important that title fields in those forms are optional.
- Is there a pronoun that every nonbinary person is happy with? – No. Singular they is a safe bet if you’re not sure what to use, being chosen by just over 75% of participants steadily for several years, and it’s more than twice as popular as the pronoun that took second place. But that leaves one quarter of us who don’t want to be called they, and one in ten of us don’t like to be called he, she or they, so it’s always good to check.
- Is there any consensus on a gender-exclusive nonbinary pronoun? – No. There are no neopronouns gaining ground or being chosen/entered by over 10% of participants.
This year in review
- Participation. There were four times as many participants as there were in the 2019 survey two years ago. There are so many responses that I can’t fit them plus the processed results onto just one Google Sheet, due to the 5 million cell limit. It’s official: I will need to switch to Excel, which means I definitely need to upgrade my computer.
- Crowdfunding. The new Patreon page was a big success, everything was funded without having to run a one-off crowdfunding campaign with a deadline! I was bitten by Patreon’s fees, which turned out to be 17% (ouch) – I will adjust the goals on the Patreon page to reflect this.
- The crowdfunding also covered coding assistance from Andréa, who created a search/filter for the identity words question. Anyone struggling to find their identity in the randomised list could type their term into the textbox to find their identity more easily, and there was some really positive feedback about that. Her support was invaluable, and if you want to express your appreciation you can click here.
- New information. There are new website pages, blog posts, and survey guidance:
- A page on the website about data protection.
- A page on the website listing ways the results have been used.
- Guidance for plural participants, with a new section in the FAQ.
- Guidance in the FAQ on whether binary trans people can take part.
- A blog post on collecting data about languages other than English.
- A blog post on censoring words when responding to the Gender Census.
What I’ll do differently next year
In no particular order:
- Software. I’m going to have to switch from Google Sheets to Excel because of the number of participants. That means processed statistical information won’t be as accessible to casual readers, because people will have to download the Excel file and have Excel software to open it. (Plus, my computer cannot deal with a spreadsheet that large so I will have to upgrade it, and my Excel skills are a little rusty.)
- The identity question. I will rephrase the questions a little based on feedback, and I will ask people not to censor their words in the survey itself.
- The pronoun question. I intend to split “mix it up” into two checkbox options, along the lines of:
- My pronouns vary depending on specific criteria
- I like people to randomly and frequently change the pronouns they use for me
- One-off questions. I am considering:
- “Have you taken part in the Gender Census before?” (And, “if so, have your answers changed since you last took part?”)
- Perhaps a second pronoun checkbox question: “Which pronouns are NOT okay for people to use when talking about you?” I would then present it in the report as a one-off graph of (tongue in cheek!) “least-accepted” pronouns.
- Location. There are now enough participants that I think I could safely collect information about participants’ individual countries beyond UK/not UK. Any country that has fewer than 10 respondents can be aggregated for privacy, which would be extra work, but I believe the quality of the data would make that worthwhile. This change would allow someone in a particular country to analyse, summarise and publish the results from only that country, and use it in nationally applicable activism and academia.
- Survey URL. For several years the most popular query on social media has been whether participants outside of the UK can participate, even though all the promotional social media posts say that the survey is international. I asked around a little and found that most people who thought it might be a UK-only survey thought so because of the .co.uk in the survey URL. Next year I will look into making the survey URL part of gendercensus.com instead, so that no one is put off by the country-specific domain.
Closing thoughts
As always, it has been fascinating, fun, and an honour to run this survey. I am very grateful to everyone who took part, everyone who told someone else about the survey, and everyone who contributed to the Patreon crowdfunding effort. I say that I am powered by curiosity, and that is true, but the collective contributions of tens of thousands of people definitely makes the mission easier and more interesting!
Support me!
Thank you for reading! If you find it to be valuable and would like to give something back, you could pledge to support the survey financially on Patreon, or increase your chances of taking part in future surveys by following on Tumblr, Twitter or the Fediverse, or subscribing to the mailing list. Alternatively, you could take a look at my Amazon wishlist.
Links to spreadsheets
Corrections
2021-12-18:
- The colourful diagram of the top 10 identity words compared by age groups was amended in light of a spreadsheet error that was discovered and corrected.
- The titles pie chart was updated with “everything not in the top 10” as a category, so that the percentages in the illustration match the percentages in the data table.
2022-07-13: Removed an unnecessarily insulting phrase regarding the bisexual respondents! Sorry folks, ugh @ me.
2021-04-01
email: hello@gendercensus.com